Target 2008 Annual Report Download - page 37
Download and view the complete annual report
Please find page 37 of the 2008 Target annual report below. You can navigate through the pages in the report by either clicking on the pages listed below, or by using the keyword search tool below to find specific information within the annual report.-
 1
1 -
2
-
3
-
4
-
5
-
6
-
7
-
8
-
9
-
10
-
11
-
12
-
13
-
14
-
15
-
16
-
17
-
18
-
19
-
20
-
21
-
22
-
23
-
24
-
25
-
26
-
 27
27 -
 28
28 -
 29
29 -
 30
30 -
 31
31 -
 32
32 -
 33
33 -
 34
34 -
 35
35 -
 36
36 -
 37
37 -
 38
38 -
 39
39 -
 40
40 -
 41
41 -
 42
42 -
 43
43 -
 44
44 -
 45
45 -
 46
46 -
 47
47 -
48
-
49
-
50
-
51
-
52
-
53
-
54
-
55
-
56
-
57
-
58
-
59
-
60
-
61
-
62
-
63
-
64
-
65
-
66
-
67
-
68
-
69
-
70
-
71
-
72
-
73
-
74
-
75
-
76
-
77
-
78
-
79
-
80
-
81
-
82
-
83
-
84
 |
 |

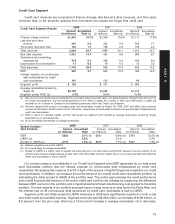
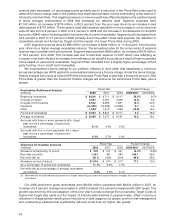
2007 period-end receivables were $8,624 million compared with $6,711 million in 2006, an increase of
28.5 percent. Average receivables in 2007 increased 18.1 percent to $7,275 million from $6,161 million. This
growth in receivables measure was driven primarily by a product change from proprietary Target Cards to
Target Visa cards for a group of higher credit-quality Target Card Guests. A product change to a Target Visa
card generally results in a higher receivables balance because it can be used for purchases outside of Target
stores and has a higher credit limit. Accounts converted from a Target Card to a Target Visa accounted for
approximately 20 percentage points of the growth in period-end receivables. The remainder of our
year-over-year receivables growth was primarily due to a reduction in payment rates on non-converted
accounts.
Other Performance Factors
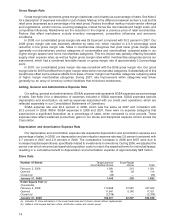
Net Interest Expense
Net interest expense was $866 million at the end of 2008, increasing 33.8 percent, or $219 million from
2007. This increase was due primarily to higher average debt balances supporting capital investment, share
repurchase and the receivables portfolio, partially offset by a lower average portfolio net interest rate. In 2007,
net interest expense was $647 million compared with $572 million in 2006, an increase of 13.2 percent. This
increase related to higher average debt balances, including the debt to fund growth in accounts receivable.
The average portfolio interest rate was 5.3 percent in 2008, 6.1 percent in 2007 and 6.2 percent in 2006.
Provision for Income Taxes
Our effective income tax rate was 37.4 percent in 2008, 38.4 percent in 2007 and 38.0 percent in 2006.
The decrease in 2008 was primarily due to tax reserve reductions resulting from audit settlements and the
effective resolution of other issues. The 2008 effective income tax rate is also lower due to a comparatively
greater proportion of earnings subject to rate differences between taxing jurisdictions. These rate declines
were partially offset by lower capital market returns on investments used to economically hedge the market
risk in deferred compensation plans. Gains and losses from these investments are not taxable. The increase in
the 2007 effective rate from the prior year was primarily due to lower capital market returns on these
investments as compared to 2006.
Workforce Reduction
In 2008, we recorded a $47 million charge related to workforce reduction actions, approximately
$21 million of which related to actions announced in January 2009 affecting our headquarters population. This
charge was comprised of severance and benefit costs of $37 million and other expenses, primarily early lease
exit costs, of $10 million. At the end of 2008, the remaining liability balance relating to severance costs was
approximately $31 million. We believe that the liability will be substantially extinguished by the end of the first
quarter of 2009. The liability is recorded as a component of other current liabilities and the expenses are
recorded as a component of SG&A.
We will incur costs in 2009 for workforce reduction actions announced in 2008 but where team members
are required to provide future services. We estimate those costs will be approximately $11 million and
generally represent severance and benefits costs to be paid during 2009.
Liquidity and Capital Resources
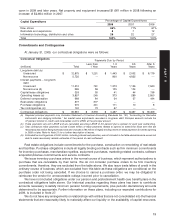
We continue to fund our operations and growth through a combination of internally generated funds and
debt financing. Cash flow provided by operations was $4,430 million in 2008 compared with $4,125 million in
2007.
Our 2008 period-end gross receivables were $9,094 million compared with $8,624 million in 2007, an
increase of 5.4 percent. Average receivables in 2008 increased 19.5 percent compared with 2007 levels. This
growth was driven by the annualization of the prior year’s product change from proprietary Target Cards to
higher-limit Target Visa cards and the impact of industry-wide declines in payment rates, offset in part by a
reduction in charge activity resulting from risk management and underwriting initiatives that significantly
17
PART II
Analysis of Financial Condition