Target 2008 Annual Report Download - page 35
Download and view the complete annual report
Please find page 35 of the 2008 Target annual report below. You can navigate through the pages in the report by either clicking on the pages listed below, or by using the keyword search tool below to find specific information within the annual report.-
 1
1 -
2
-
3
-
4
-
5
-
6
-
7
-
8
-
9
-
10
-
11
-
12
-
13
-
14
-
15
-
16
-
17
-
18
-
19
-
20
-
21
-
22
-
23
-
24
-
 25
25 -
 26
26 -
 27
27 -
 28
28 -
 29
29 -
 30
30 -
 31
31 -
 32
32 -
 33
33 -
 34
34 -
 35
35 -
 36
36 -
 37
37 -
 38
38 -
 39
39 -
 40
40 -
 41
41 -
 42
42 -
 43
43 -
 44
44 -
 45
45 -
46
-
47
-
48
-
49
-
50
-
51
-
52
-
53
-
54
-
55
-
56
-
57
-
58
-
59
-
60
-
61
-
62
-
63
-
64
-
65
-
66
-
67
-
68
-
69
-
70
-
71
-
72
-
73
-
74
-
75
-
76
-
77
-
78
-
79
-
80
-
81
-
82
-
83
-
84
 |
 |

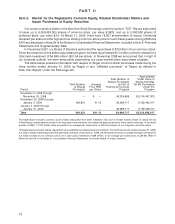
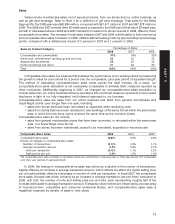
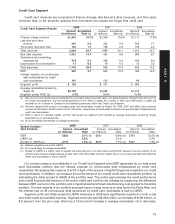
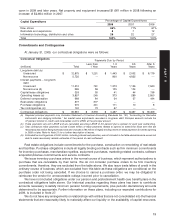
Credit Card Segment
Credit card revenues are comprised of finance charges, late fees and other revenues, and third party
merchant fees, or the amounts received from merchants who accept the Target Visa credit card.
2008 2007 2006
Credit Card Segment Results
Amount Annualized Amount Annualized Amount Annualized
(in millions) Rate (d) (in millions) Rate (d) (in millions) Rate (d)
Finance charge revenue $1,451 16.7% $1,308 18.0% $1,117 17.8%
Late fees and other
revenue 461 5.3 422 5.8 356 5.7
Third party merchant fees 152 1.7 166 2.3 139 2.2
Total revenues 2,064 23.7 1,896 26.1 1,612 25.7
Bad debt expense 1,251 14.4 481 6.6 380 6.1
Operations and marketing
expenses (a) 474 5.4 469 6.4 434 6.9
Depreciation and amortization 17 0.2 16 0.2 15 0.2
Total expenses 1,742 20.0 966 13.3 829 13.2
EBIT 322 3.7 930 12.8 783 12.5
Interest expense on nonrecourse
debt collateralized by credit
card receivables 167 133 98
Segment profit $ 155 $ 797 $ 685
Average receivables funded by
Target (b) $4,192 $4,888 $4,379
Segment pretax ROIC (c) 3.7% 16.3% 15.3%
(a) New account and loyalty rewards redeemed by our guests reduce reported sales. Our Retail Segment charges these discounts to
our Credit Card Segment, and the reimbursements of $117 million in 2008, $114 million in 2007 and $109 million in 2006, are
recorded as an increase to Operations and Marketing expenses within the Credit Card Segment.
(b) Amounts represent the portion of average credit card receivables funded by Target. For 2008, 2007 and 2006, these amounts
exclude $4,503 million, $2,387 million and $1,782 million, respectively, of receivables funded by nonrecourse debt collateralized by
credit card receivables.
(c) ROIC is return on invested capital, and this rate equals our segment profit divided by average receivables funded by Target,
expressed as an annualized rate.
(d) As an annualized percentage of average receivables.
2008 2007 2006
Spread Analysis –
Total Portfolio Amount Annualized Amount Annualized Amount Annualized
(in millions) Rate (in millions) Rate (in millions) Rate
EBIT $322 3.7% (b) $930 12.8% (b) $783 12.5% (b)
LIBOR (a) 2.3% 5.1% 5.2%
Spread to LIBOR (c) $118 1.4% (b) $558 7.7% (b) $450 7.3% (b)
(a) Balance-weighted one-month LIBOR
(b) As a percentage of average receivables
(c) Spread to LIBOR is a metric used to analyze the performance of our total credit card portfolio because the vast majority of our
portfolio earns finance charge revenue at rates tied to the Prime Rate, and the interest rate on all nonrecourse debt securitized by
credit card receivables is tied to LIBOR.
Our primary measure of profitability in our Credit Card Segment is the EBIT generated by our total credit
card receivables portfolio less the interest expense on nonrecourse debt collateralized by credit card
receivables. We analyze this measure of profit in light of the amount of capital Target has invested in our credit
card receivables. In addition, we measure the performance of our overall credit card receivables portfolio by
calculating the dollar spread to LIBOR at the portfolio level. This metric approximates the credit performance
and overall financial performance of the entire credit card portfolio we manage by measuring the difference
between EBIT earned on the portfolio and a hypothetical benchmark rate financing cost applied to the entire
portfolio. The vast majority of our portfolio accrues finance charge revenue at rates tied to the Prime Rate, and
the interest rate on all nonrecourse debt securitized by credit card receivables is tied to LIBOR.
Segment profit and dollar spread to LIBOR measures in 2008 were significantly impacted on both a rate
and dollar basis by bad debt expense. Segment revenues were $2,064 million, an increase of $168 million, or
8.9 percent, from the prior year, driven by a 19.5 percent increase in average receivables. On a rate basis,
15
PART II