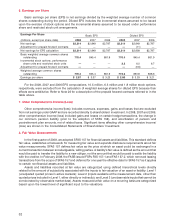
Target 2008 Annual Report Download - page 48
Download and view the complete annual report
Please find page 48 of the 2008 Target annual report below. You can navigate through the pages in the report by either clicking on the pages listed below, or by using the keyword search tool below to find specific information within the annual report.-
 1
1 -
2
-
3
-
4
-
5
-
6
-
7
-
8
-
9
-
10
-
11
-
12
-
13
-
14
-
15
-
16
-
17
-
18
-
19
-
20
-
21
-
22
-
23
-
24
-
25
-
26
-
27
-
28
-
29
-
30
-
31
-
32
-
33
-
34
-
35
-
36
-
37
-
 38
38 -
 39
39 -
 40
40 -
 41
41 -
 42
42 -
 43
43 -
 44
44 -
 45
45 -
 46
46 -
 47
47 -
 48
48 -
 49
49 -
 50
50 -
 51
51 -
 52
52 -
 53
53 -
 54
54 -
 55
55 -
 56
56 -
 57
57 -
 58
58 -
59
-
60
-
61
-
62
-
63
-
64
-
65
-
66
-
67
-
68
-
69
-
70
-
71
-
72
-
73
-
74
-
75
-
76
-
77
-
78
-
79
-
80
-
81
-
82
-
83
-
84
 |
 |

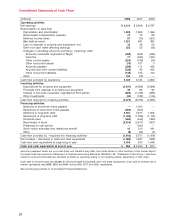
Consolidated Statements of Cash Flows
(millions) 2008 2007 2006
Operating activities
Net earnings $ 2,214 $ 2,849 $ 2,787
Reconciliation to cash flow
Depreciation and amortization 1,826 1,659 1,496
Share-based compensation expense 72 73 99
Deferred income taxes 91 (70) (201)
Bad debt provision 1,251 481 380
Loss on disposal of property and equipment, net 33 28 53
Other non-cash items affecting earnings 222 52 (35)
Changes in operating accounts providing / (requiring) cash:
Accounts receivable originated at Target (458) (602) (226)
Inventory 77 (525) (431)
Other current assets (224) (139) (30)
Other noncurrent assets (76) 101 5
Accounts payable (389) 111 435
Accrued and other current liabilities (230) 62 430
Other noncurrent liabilities (139) 124 100
Other 160 (79) —
Cash flow provided by operations 4,430 4,125 4,862
Investing activities
Expenditures for property and equipment (3,547) (4,369) (3,928)
Proceeds from disposal of property and equipment 39 95 62
Change in accounts receivable originated at third parties (823) (1,739) (683)
Other investments (42) (182) (144)
Cash flow required for investing activities (4,373) (6,195) (4,693)
Financing activities
Additions to short-term notes payable —1,000 —
Reductions of short-term notes payable (500) (500) —
Additions to long-term debt 3,557 7,617 1,256
Reductions of long-term debt (1,455) (1,326) (1,155)
Dividends paid (465) (442) (380)
Repurchase of stock (2,815) (2,477) (901)
Premiums on call options —(331) —
Stock option exercises and related tax benefit 43 210 181
Other (8) (44) (5)
Cash flow provided by / (required for) financing activities (1,643) 3,707 (1,004)
Net increase / (decrease) in cash and cash equivalents (1,586) 1,637 (835)
Cash and cash equivalents at beginning of year 2,450 813 1,648
Cash and cash equivalents at end of year $ 864 $ 2,450 $ 813
Amounts presented herein are on a cash basis and therefore may differ from those shown in other sections of this Annual Report.
Consistent with the provisions of Statement of Financial Accounting Standards (SFAS) No. 95, ‘‘Statement of Cash Flows,’’ cash flows
related to accounts receivable are classified as either an operating activity or an investing activity, depending on their origin.
Cash paid for income taxes was $1,399, $1,734 and $1,823 during 2008, 2007 and 2006, respectively. Cash paid for interest (net of
interest capitalized) was $873, $633 and $584 during 2008, 2007 and 2006, respectively.
See accompanying Notes to Consolidated Financial Statements.
28