Target 2008 Annual Report Download - page 70
Download and view the complete annual report
Please find page 70 of the 2008 Target annual report below. You can navigate through the pages in the report by either clicking on the pages listed below, or by using the keyword search tool below to find specific information within the annual report.-
 1
1 -
2
-
3
-
4
-
5
-
6
-
7
-
8
-
9
-
10
-
11
-
12
-
13
-
14
-
15
-
16
-
17
-
18
-
19
-
20
-
21
-
22
-
23
-
24
-
25
-
26
-
27
-
28
-
29
-
30
-
31
-
32
-
33
-
34
-
35
-
36
-
37
-
38
-
39
-
40
-
41
-
42
-
43
-
44
-
45
-
46
-
47
-
48
-
49
-
50
-
51
-
52
-
53
-
54
-
55
-
56
-
57
-
58
-
59
-
 60
60 -
 61
61 -
 62
62 -
 63
63 -
 64
64 -
 65
65 -
 66
66 -
 67
67 -
 68
68 -
 69
69 -
 70
70 -
 71
71 -
 72
72 -
 73
73 -
 74
74 -
 75
75 -
 76
76 -
 77
77 -
 78
78 -
 79
79 -
 80
80 -
81
-
82
-
83
-
84
 |
 |

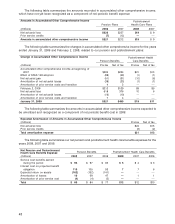
Additional Information
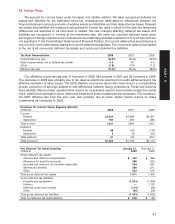
Our pension plan weighted average asset allocations at the measurement date by asset category were as
follows:
Asset Category 2008 2007
Domestic equity securities 25% 31%
International equity securities 13 17
Debt securities 27 25
Other (a) 35 27
Total 100% 100%
(a) Other assets include private equity, mezzanine and distressed debt, a balanced portfolio of global equities and global fixed income
securities, timber-related assets, and a 5 percent allocation to real estate.
Our asset allocation strategy targets 32 percent in domestic equity securities, 18 percent in international
equity securities, 23 percent in high quality, long-duration debt securities, including interest rate swaps, and
27 percent in alternative assets. Equity securities include our common stock in amounts substantially less
than 1 percent of total plan assets as of January 31, 2009 and February 2, 2008. Our expected annualized
long-term rate of return assumptions as of January 31, 2009 were 8.5 percent for domestic and international
equity securities, 5.5 percent for long-duration debt securities, and 9.5 percent for other assets.
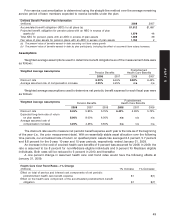
Contributions
We are not required to make any contributions in 2009, although we may choose to make discretionary
contributions of up to $100 million. We expect to make contributions in the range of $5 million to $15 million to
our postretirement health care benefit plan in 2009.
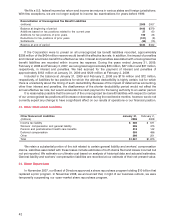
Estimated Future Benefit Payments
Benefit payments by the plans, which reflect expected future service as appropriate, are expected to be
paid as follows:
Estimated Future Benefit Payments Postretirement
Pension Health Care
(millions) Benefits Benefits
2009 $111 $10
2010 120 10
2011 126 11
2012 133 12
2013 140 12
2014-2018 825 76
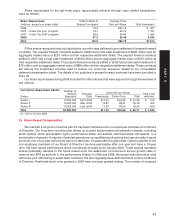
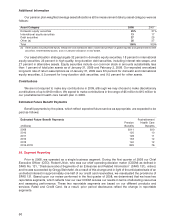
Prior to 2008, we operated as a single business segment. During the first quarter of 2008 our Chief
Executive Officer (CEO), Robert Ulrich, who was our chief operating decision maker (CODM) as defined in
SFAS No. 131, ‘‘Disclosure about Segments of an Enterprise and Related Information’’ (SFAS 131), retired,
and he was succeeded by Gregg Steinhafel. As a result of this change and in light of the anticipated sale of an
undivided interest in approximately one-half of our credit card receivables, we reevaluated the provisions of
SFAS 131. Based upon our review performed in the first quarter of 2008, we determined that we have two
reportable segments, which reflects how our new CODM reviews our results in terms of allocating resources
and assessing performance. These two reportable segments are based on our different products and
services: Retail and Credit Card. As a result, prior period disclosures reflect the change in reportable
segments.
50
28. Segment Reporting