Target 2008 Annual Report Download - page 55
Download and view the complete annual report
Please find page 55 of the 2008 Target annual report below. You can navigate through the pages in the report by either clicking on the pages listed below, or by using the keyword search tool below to find specific information within the annual report.-
 1
1 -
2
-
3
-
4
-
5
-
6
-
7
-
8
-
9
-
10
-
11
-
12
-
13
-
14
-
15
-
16
-
17
-
18
-
19
-
20
-
21
-
22
-
23
-
24
-
25
-
26
-
27
-
28
-
29
-
30
-
31
-
32
-
33
-
34
-
35
-
36
-
37
-
38
-
39
-
40
-
41
-
42
-
43
-
44
-
 45
45 -
 46
46 -
 47
47 -
 48
48 -
 49
49 -
 50
50 -
 51
51 -
 52
52 -
 53
53 -
 54
54 -
 55
55 -
 56
56 -
 57
57 -
 58
58 -
 59
59 -
 60
60 -
 61
61 -
 62
62 -
 63
63 -
 64
64 -
 65
65 -
66
-
67
-
68
-
69
-
70
-
71
-
72
-
73
-
74
-
75
-
76
-
77
-
78
-
79
-
80
-
81
-
82
-
83
-
84
 |
 |

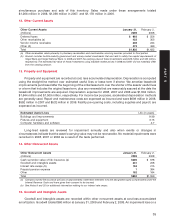
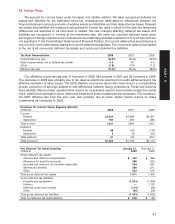
simultaneous purchase and sale of this inventory. Sales made under these arrangements totaled
$1,266 million in 2008, $1,390 million in 2007, and $1,178 million in 2006.
12. Other Current Assets
Other Current Assets January 31, February 2,
(millions) 2009 2008
Deferred taxes $ 693 $ 556
Other receivables (a) 433 353
Vendor income receivable 236 244
Other (b) 473 469
Total $1,835 $1,622
(a) Other receivables relate primarily to pharmacy receivables and merchandise sourcing services provided to third parties.
(b) Amount includes held-to-maturity government and money market investments that are held to satisfy the capital requirements of
Target Bank and Target National Bank. In 2008 and 2007 the carrying value of these investments were $29 million and $25 million,
respectively. The estimated fair value of these investments using available market prices in 2008 and 2007 did not materially differ
from the carrying amount.
13. Property and Equipment
Property and equipment are recorded at cost, less accumulated depreciation. Depreciation is computed
using the straight-line method over estimated useful lives or lease term if shorter. We amortize leasehold
improvements purchased after the beginning of the initial lease term over the shorter of the assets’ useful lives
or a term that includes the original lease term, plus any renewals that are reasonably assured at the date the
leasehold improvements are acquired. Depreciation expense for 2008, 2007 and 2006 was $1,804 million,
$1,644 million and $1,509 million, respectively. For income tax purposes, accelerated depreciation methods
are generally used. Repair and maintenance costs are expensed as incurred and were $609 million in 2008,
$592 million in 2007 and $532 million in 2006. Facility pre-opening costs, including supplies and payroll, are
expensed as incurred.
Estimated Useful Lives Life (in years)
Buildings and improvements 8-39
Fixtures and equipment 3-15
Computer hardware and software 4-7
Long-lived assets are reviewed for impairment annually and also when events or changes in
circumstances indicate that the asset’s carrying value may not be recoverable. No material impairments were
recorded in 2008, 2007 or 2006 as a result of the tests performed.
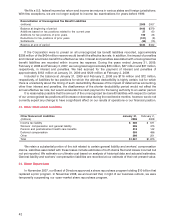
14. Other Noncurrent Assets
Other Noncurrent Assets January 31, February 2,
(millions) 2009 2008
Cash surrender value of life insurance (a) $305 $ 578
Goodwill and intangible assets 231 208
Interest rate swaps (b) 163 215
Prepaid pension expense 1394
Other 162 164
Total $862 $1,559
(a) Company-owned life insurance policies on approximately 4,000 team members who are designated highly compensated under the
Internal Revenue Code and have given their consent to be insured.
(b) See Notes 8 and 20 for additional information relating to our interest rate swaps.
15. Goodwill and Intangible Assets
Goodwill and intangible assets are recorded within other noncurrent assets at cost less accumulated
amortization. Goodwill totaled $60 million at January 31, 2009 and February 2, 2008. An impairment loss on a
35
PART II