Target 2008 Annual Report Download - page 34
Download and view the complete annual report
Please find page 34 of the 2008 Target annual report below. You can navigate through the pages in the report by either clicking on the pages listed below, or by using the keyword search tool below to find specific information within the annual report.-
 1
1 -
2
-
3
-
4
-
5
-
6
-
7
-
8
-
9
-
10
-
11
-
12
-
13
-
14
-
15
-
16
-
17
-
18
-
19
-
20
-
21
-
22
-
23
-
 24
24 -
 25
25 -
 26
26 -
 27
27 -
 28
28 -
 29
29 -
 30
30 -
 31
31 -
 32
32 -
 33
33 -
 34
34 -
 35
35 -
 36
36 -
 37
37 -
 38
38 -
 39
39 -
 40
40 -
 41
41 -
 42
42 -
 43
43 -
 44
44 -
45
-
46
-
47
-
48
-
49
-
50
-
51
-
52
-
53
-
54
-
55
-
56
-
57
-
58
-
59
-
60
-
61
-
62
-
63
-
64
-
65
-
66
-
67
-
68
-
69
-
70
-
71
-
72
-
73
-
74
-
75
-
76
-
77
-
78
-
79
-
80
-
81
-
82
-
83
-
84
 |
 |

Gross Margin Rate
Gross margin rate represents gross margin (sales less cost of sales) as a percentage of sales. See Note 3
for a description of expenses included in cost of sales. Markup is the difference between an item’s cost and its
retail price (expressed as a percentage of its retail price). Factors that affect markup include vendor offerings
and negotiations, vendor income, sourcing strategies, market forces like raw material and freight costs, and
competitive influences. Markdowns are the reduction in the original or previous price of retail merchandise.
Factors that affect markdowns include inventory management, competitive influences and economic
conditions.
In 2008, our consolidated gross margin rate was 29.8 percent compared with 30.2 percent in 2007. Our
2008 gross margin rate was adversely affected by sales mix, which resulted in a 0.6 percentage point
reduction in the gross margin rate. Sales in merchandise categories that yield lower gross margin rates
(generally non-discretionary product categories of consumables and commodities) outpaced sales in our
higher margin apparel and home merchandise categories. This mix impact was partially offset by favorable
supply chain expense rates, as well as higher gross margin rates within merchandise categories across our
assortment, which had a combined favorable impact on gross margin rate of approximately 0.2 percentage
point.
In 2007, our consolidated gross margin rate was consistent with the 2006 gross margin rate. Our gross
margin rate for 2007 benefited from higher margin rates within merchandise categories. Substantially all of this
benefit was offset by the adverse effects from sales of lower margin merchandise categories outpacing sales
of higher margin merchandise categories. During 2007, rate improvement within categories was driven
generally by an array of inventory control initiatives that minimized markdowns.
Selling, General and Administrative Expense Rate
Our selling, general and administrative (SG&A) expense rate represents SG&A expenses as a percentage
of sales. See Note 3 for a description of expenses included in SG&A expenses. SG&A expenses exclude
depreciation and amortization, as well as expenses associated with our credit card operations, which are
reflected separately in our Consolidated Statements of Operations.
SG&A expense rate was 20.4 percent in 2008, which was the same as 2007 and consistent with
20.3 percent in 2006. Within SG&A expenses in 2008 and 2007, there were no expense categories that
experienced a significant fluctuation as a percentage of sales, when compared to prior periods. These
expense rates reflect sustained productivity gains in our stores and disciplined expense control across the
Corporation.
Depreciation and Amortization Expense Rate
Our depreciation and amortization expense rate represents depreciation and amortization expense as a
percentage of sales. In 2008, our depreciation and amortization expense rate was 2.9 percent compared with
2.7 percent in 2007 and 2.6 percent in 2006. The comparative increases in 2008 and 2007 were due to
increased capital expenditures, specifically related to investments in new stores. During 2006, we adjusted the
period over which we amortize leasehold acquisition costs to match the expected terms for individual leases,
resulting in a cumulative benefit to depreciation and amortization expense of approximately $28 million.
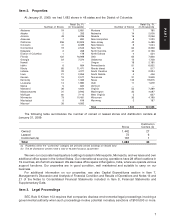
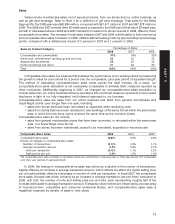
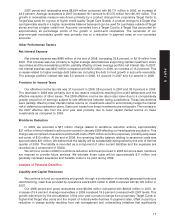
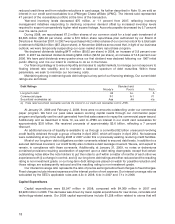
Store Data
Number of Stores Target general SuperTarget
merchandise stores stores Total
February 2, 2008 1,381 210 1,591
Opened 85 29 114
Closed (a) (23) — (23)
January 31, 2009 1,443 239 1,682
Retail Square Feet (b)
(thousands)
February 2, 2008 170,858 37,087 207,945
Opened 11,841 5,180 17,021
Closed (a) (2,378) — (2,378)
January 31, 2009 180,321 42,267 222,588
(a) Includes 21 store relocations in the same trade area and 2 stores closed without replacement.
(b) Reflects total square feet less office, distribution center and vacant space.
14