Verizon Wireless 2009 Annual Report Download - page 15
Download and view the complete annual report
Please find page 15 of the 2009 Verizon Wireless annual report below. You can navigate through the pages in the report by either clicking on the pages listed below, or by using the keyword search tool below to find specific information within the annual report.-
 1
1 -
2
-
3
-
4
-
 5
5 -
 6
6 -
 7
7 -
 8
8 -
 9
9 -
 10
10 -
 11
11 -
 12
12 -
 13
13 -
 14
14 -
 15
15 -
 16
16 -
 17
17 -
 18
18 -
 19
19 -
 20
20 -
 21
21 -
 22
22 -
 23
23 -
 24
24 -
 25
25 -
26
-
27
-
28
-
29
-
30
-
31
-
32
-
33
-
34
-
35
-
36
-
37
-
38
-
39
-
40
-
41
-
42
-
43
-
44
-
45
-
46
-
47
-
48
-
49
-
50
-
51
-
52
-
53
-
54
-
55
-
56
-
57
-
58
-
59
-
60
-
61
-
62
-
63
-
64
-
65
-
66
-
67
-
68
-
69
-
70
-
71
-
72
-
73
-
74
-
75
-
76
-
77
-
78
-
79
-
80
 |
 |
13
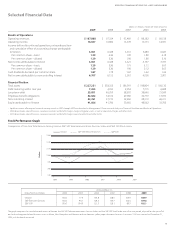
Selected Financial Data
VERIZON COMMUNICATIONS INC. AND SUBSIDIARIES
Verizon S&P 500 Telecom Services S&P 500
Stock Performance Graph
$100
$80
$60
$40
$140
$120
$160
2004 2005 2006 2007 2008 2009
Dollars
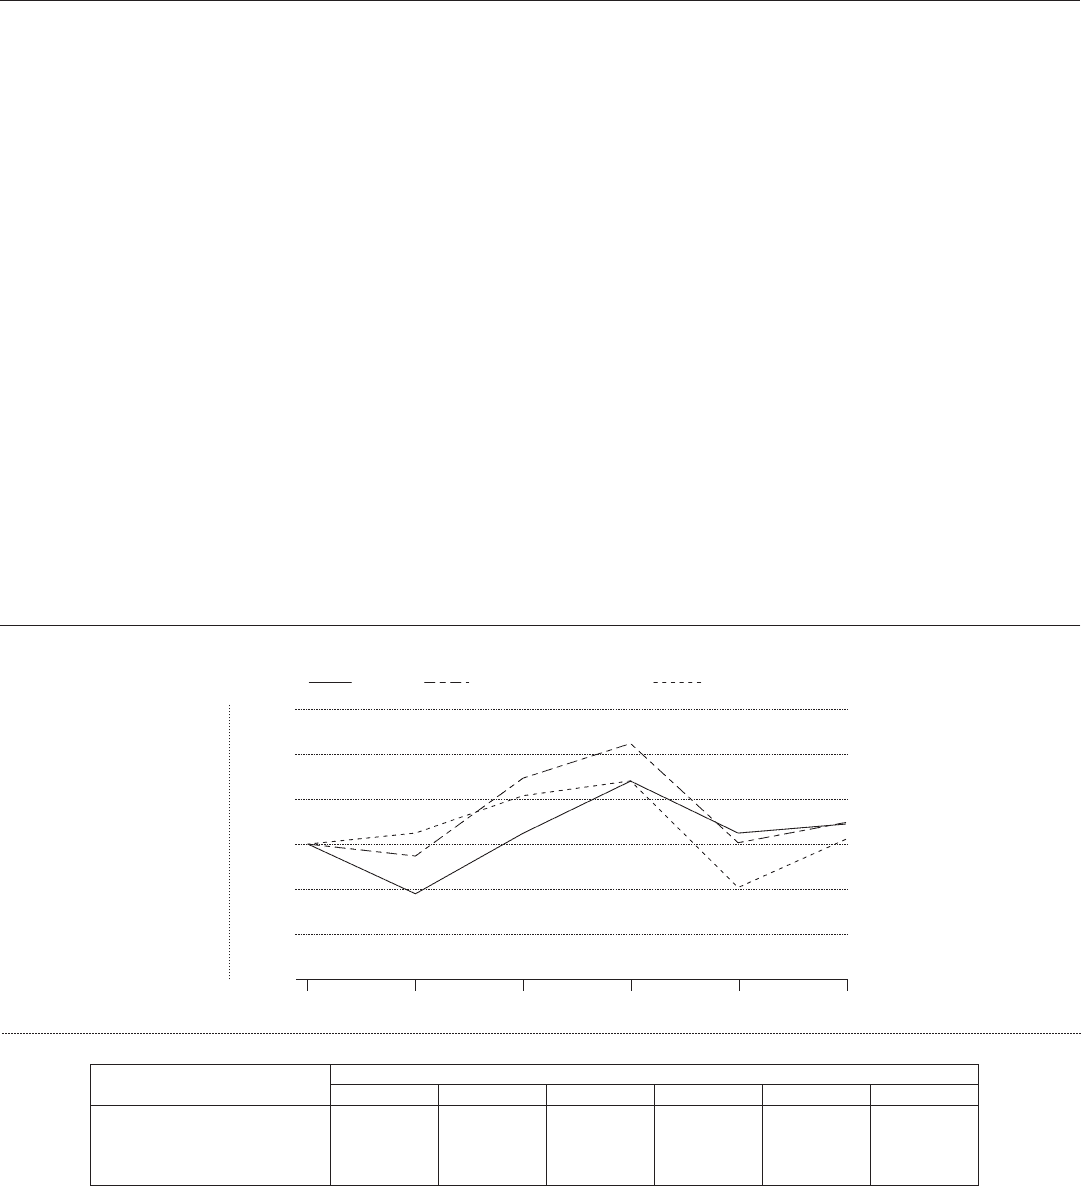
Comparison of Five-Year Total Return Among Verizon, S&P 500 Telecommunications Services Index and S&P 500 Stock Index
The graph compares the cumulative total returns of Verizon, the S&P 500 Telecommunications Services Index, and the S&P 500 Stock Index over a five-year period, adjusted for the spin-off of
our local exchange and related business assets in Maine, New Hampshire and Vermont and our domestic yellow pages directories business. It assumes $100 was invested on December 31,
2004, with dividends reinvested.
Data Points in Dollars
At December 31,
2004 2005 2006 2007 2008 2009
Verizon 100.0 77.9 104.8 128.0 104.9 108.9
S&P Telecom Services 100.0 94.7 129.3 144.7 100.6 109.6
S&P 500 100.0 104.9 121.5 128.1 80.7 102.1
(dollars in millions, except per share amounts)
2009 2008 2007 2006 2005
Results of Operations
Operating revenues $ 107,808 $ 97,354 $ 93,469 $ 88,182 $ 69,518
Operating income 14,027 16,884 15,578 13,373 12,581
Income before discontinued operations, extraordinary item
and cumulative effect of accounting change attributable
to Verizon 3,651 6,428 5,510 5,480 6,027
Per common share – basic 1.29 2.26 1.90 1.88 2.18
Per common share – diluted 1.29 2.26 1.90 1.88 2.16
Net income attributable to Verizon 3,651 6,428 5,521 6,197 7,397
Per common share – basic 1.29 2.26 1.91 2.13 2.67
Per common share – diluted 1.29 2.26 1.90 2.12 2.65
Cash dividends declared per common share 1.87 1.78 1.67 1.62 1.62
Net income attributable to noncontrolling interest 6,707 6,155 5,053 4,038 3,001
Financial Position
Total assets $ 227,251 $ 202,352 $ 186,959 $ 188,804 $ 168,130
Debt maturing within one year 7,205 4,993 2,954 7,715 6,688
Long-term debt 55,051 46,959 28,203 28,646 31,569
Employee benefit obligations 32,622 32,512 29,960 30,779 17,693
Noncontrolling interest 42,761 37,199 32,266 28,310 26,411
Equity attributable to Verizon 41,606 41,706 50,603 48,562 39,702
• Significant events affecting our historical earnings trends in 2007 through 2009 are described in Management’s Discussion and Analysis of Financial Condition and Results of Operations.
• 2006 data includes sales of business, severance, pension and benefit charges, merger integration costs, as well as relocation charges and other items.
• 2005 data includes sales of business, severance, pension and benefit charges, lease impairment and other items.