Verizon Wireless 2009 Annual Report Download - page 28
Download and view the complete annual report
Please find page 28 of the 2009 Verizon Wireless annual report below. You can navigate through the pages in the report by either clicking on the pages listed below, or by using the keyword search tool below to find specific information within the annual report.-
 1
1 -
2
-
3
-
4
-
5
-
6
-
7
-
8
-
9
-
10
-
11
-
12
-
13
-
14
-
15
-
16
-
17
-
 18
18 -
 19
19 -
 20
20 -
 21
21 -
 22
22 -
 23
23 -
 24
24 -
 25
25 -
 26
26 -
 27
27 -
 28
28 -
 29
29 -
 30
30 -
 31
31 -
 32
32 -
 33
33 -
 34
34 -
 35
35 -
 36
36 -
 37
37 -
 38
38 -
39
-
40
-
41
-
42
-
43
-
44
-
45
-
46
-
47
-
48
-
49
-
50
-
51
-
52
-
53
-
54
-
55
-
56
-
57
-
58
-
59
-
60
-
61
-
62
-
63
-
64
-
65
-
66
-
67
-
68
-
69
-
70
-
71
-
72
-
73
-
74
-
75
-
76
-
77
-
78
-
79
-
80
 |
 |

26
Cost of services and sales in 2008 increased by $93 million, or 0.4%,
compared to 2007. These increases were primarily due to higher costs
associated with our growth businesses, primarily FiOS services, including
TV and Internet services, and IP services, partially offset by productivity
improvement initiatives, headcount reductions and lower switched
access lines in service as well as lower wholesale voice connections.
The increase in Cost of services and sales expense was also impacted by
unfavorable foreign exchange rate changes, higher utility costs and the
inclusion of the results of operations of a security services firm acquired
on July 1, 2007.
Selling, General and Administrative Expense
Selling, general and administrative expense includes salaries, wages
and benefits not directly attributable to a service or product, bad debt
charges, taxes other than income, advertising and sales commission
costs, customer billing, call center and information technology costs, pro-
fessional service fees and rent for administrative space.
Selling, general and administrative expense in 2009 decreased by $214
million, or 1.9%, compared to 2008. The decreases were primarily due
to the decline in compensation expense as a result of lower headcount
and cost reduction initiatives, as well as favorable foreign exchange
movements.
Management’s Discussion and Analysis
of Financial Condition and Results of Operations continued
Selling, general and administrative expense in 2008 decreased by $480
million or 4.2%, compared to 2007. This decrease was primarily due to
declines in compensation expense, in part driven by headcount reduc-
tions, cost reduction initiatives, lower bad debt costs and gains on sales
of assets in 2008, partially offset by the inclusion of the results of opera-
tions of a security services firm acquired on July 1, 2007.
Depreciation and Amortization Expense
Depreciation and amortization expense in 2009 increased by $91 million,
or 1.0%, compared to 2008. The increase was driven by growth in depre-
ciable telephone plant from capital spending, partially offset by lower
rates of depreciation as a result of changes in the estimated useful lives
of certain asset classes.
Depreciation and amortization expense in 2008 increased by $104 million,
or 1.2%, compared to 2007, mainly driven by growth in depreciable tele-
phone plant and non-network software from additional capital spending,
partially offset by lower rates of depreciation as a result of changes in the
estimated useful lives of certain asset classes.
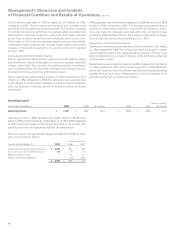
Operating Income (dollars in millions)
Years Ended December 31, 2009 2008 % Change 2008 2007 % Change
Operating Income $ 1,981 $3,862 (48.7) $3,862 $4,494 (14.1)
Operating income in 2009 decreased by $1,881 million or 48.7% com-
pared to 2008, and decreased by $632 million, or 14.1% in 2008 compared
to 2007, due to the impact of the factors described in connection with
operating revenues and operating expenses described above.
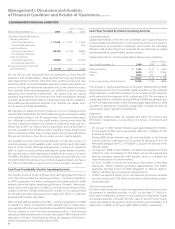
Non-recurring or non-operational charges excluded from Wireline’s oper-
ating income were as follows:
(dollars in millions)
Years Ended December 31, 2009 2008 2007
Severance, pension and benefit charges $ 3,299 $ 852 $ 699
Access line spin-off and other charges 51 34 31
Merger integration costs – 151 177
Impact of divested operations – (44) (181)
$ 3,350 $ 993 $ 726