Verizon Wireless 2009 Annual Report Download - page 27
Download and view the complete annual report
Please find page 27 of the 2009 Verizon Wireless annual report below. You can navigate through the pages in the report by either clicking on the pages listed below, or by using the keyword search tool below to find specific information within the annual report.-
 1
1 -
2
-
3
-
4
-
5
-
6
-
7
-
8
-
9
-
10
-
11
-
12
-
13
-
14
-
15
-
16
-
 17
17 -
 18
18 -
 19
19 -
 20
20 -
 21
21 -
 22
22 -
 23
23 -
 24
24 -
 25
25 -
 26
26 -
 27
27 -
 28
28 -
 29
29 -
 30
30 -
 31
31 -
 32
32 -
 33
33 -
 34
34 -
 35
35 -
 36
36 -
 37
37 -
38
-
39
-
40
-
41
-
42
-
43
-
44
-
45
-
46
-
47
-
48
-
49
-
50
-
51
-
52
-
53
-
54
-
55
-
56
-
57
-
58
-
59
-
60
-
61
-
62
-
63
-
64
-
65
-
66
-
67
-
68
-
69
-
70
-
71
-
72
-
73
-
74
-
75
-
76
-
77
-
78
-
79
-
80
 |
 |

25
movements in foreign exchange rates versus the U.S. dollar. The decline
in long distance revenue is driven by a 2.2% decline in MOUs compared
to 2008, due to continuing global economic conditions and competi-
tive rate pressures, which adversely impact our business customers.
Traditional circuit based services such as frame relay, private line and
ATM services declined compared to the similar period last year as our
customer base continues its migration to next generation IP services.
Customer premises equipment revenue decreased approximately 6.0%
compared to 2008 reflecting cautious investment decisions in the mar-
ketplace in response to the uncertain economic environment. Partially
offsetting these declines was an increase of 11.0% in IP and security
solutions revenues. Strategic services continues to be Global Enterprise’s
fastest growing suite of offerings, reflecting a 4.3% increase in revenue for
2009, compared to 2008.
Global Enterprise revenues in 2008 increased by $69 million, or 0.4%, com-
pared to 2007. The revenue increase was due to increases in customer
premise equipment revenue and security solutions revenue, partially
offset by revenue decline due to certain customers moving traffic off of
our network and lower long distance and traditional circuit based data
revenues combined with the negative effects of movements in foreign
exchange rates versus the U.S. dollar. The IP and service suite of products
continue to be Global Enterprise’s fastest growing and includes private IP,
IP, VPN, Managed Services, Web Hosting and VOIP.
Global Wholesale
Global Wholesale revenues are primarily earned from long distance and
other carriers who use our facilities to provide services to their customers.
Switched access revenues are generated from fixed and usage-based
charges paid by carriers for access to our local network, interexchange
wholesale traffic sold in the U.S., as well as internationally destined traffic
that originates in the U.S. Special access revenues are generated from car-
riers that buy dedicated local exchange capacity to support their private
networks. Wholesale services also include local wholesale revenues from
unbundled network elements and interconnection revenues from com-
petitive local exchange carriers and wireless carriers. A portion of Global
Wholesale revenues are generated by a few large telecommunication
companies, many of whom compete directly with us.
Global Wholesale revenues during 2009 decreased by $723 million, or
7.0%, compared to 2008, primarily due to decreased MOUs in traditional
voice products, and continued rate compression due to competition in
the marketplace. Switched access and interexchange wholesale MOUs
declined primarily as a result of wireless substitution and access line
losses. Wholesale lines declined by 19.7% in 2009 due to the continued
impact of competitors deemphasizing their local market initiatives
coupled with the impact of technology substitution as well as the con-
tinued level of economic pressure, as compared to an 18.8% decline in
2008. Changes in foreign exchange rates resulted in a revenue decline
of approximately 1.0% in 2009, compared to 2008. Continuing demand
for high-capacity, high-speed digital services was partially offset by lower
demand for older, low-speed data products and services. As of December
31, 2009, customer demand, as measured in DS1 and DS3 circuits, for
high-capacity and digital data services increased 2.2% compared to an
increase of 5.1% in 2008.
Global Wholesale revenues in 2008 decreased by $390 million, or 3.6%,
compared to 2007 due to declines in switched access revenues in tradi-
tional voice products and local wholesale revenues and continued rate
compression in the marketplace, partially offset by increases in special
access revenues. Switched MOUs declined in 2008, reflecting the impact
of access line losses and wireless substitution. Wholesale lines decreased
by 18.8% in 2008 due to the continued impact of competitors deempha-
sizing their local market initiatives coupled with the impact of technology
substitution compared to a 16.1% decline in 2007. Special access revenue
growth reflects continuing demand for high-capacity, high-speed dig-
ital services, partially offset by lower demand for older, low-speed data
products and services. As of December 31, 2008, customer demand, as
measured in DS1 and DS3 circuits, for high-capacity and digital data ser-
vices increased 5.1% compared to an increase of 8.2% in 2007.
The FCC regulates the rates charged to customers for interstate access
services. See “Other Factors That May Affect Future Results – Regulatory
and Competitive Trends – FCC Regulation” for additional information on
FCC rulemaking concerning federal access rates, universal service and
certain broadband services.
Other Revenues
Other revenues include such services as local exchange and long
distance services from former MCI mass market customers, operator ser-
vices, pay phone, card services and supply sales, as well as dial around
services including 10-10-987, 10-10-220, 1-800-COLLECT and prepaid
cards. Revenues from other services during 2009 decreased $576 million,
or 25.3%, compared to 2008, mainly due to the discontinuation of non-
strategic product lines and reduced business volumes, including former
MCI mass market customer losses.
Other revenues decreased by $823 million, or 26.6% in 2008, mainly due
to the discontinuation of non-strategic product lines and reduced busi-
ness volumes.
Management’s Discussion and Analysis
of Financial Condition and Results of Operations continued
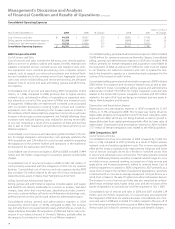
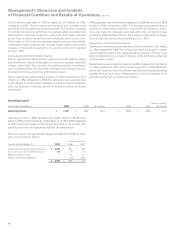
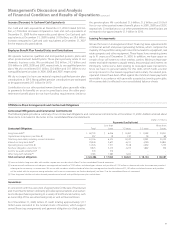
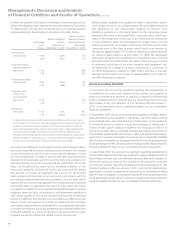
Operating Expenses (dollars in millions)
Years Ended December 31, 2009 2008 % Change 2008 2007 % Change
Cost of services and sales $ 24,144 $ 24,274 (0.5) $ 24,274 $ 24,181 0.4
Selling, general and administrative expense 10,833 11,047 (1.9) 11,047 11,527 (4.2)
Depreciation and amortization expense 9,122 9,031 1.0 9,031 8,927 1.2
Total Operating Expenses $ 44,099 $ 44,352 (0.6) $ 44,352 $ 44,635 (0.6)
Cost of Services and Sales
Cost of services and sales includes costs directly attributable to a ser-
vice or product, including salaries and wages, benefits, materials and
supplies, contracted services, network access and transport costs, cus-
tomer provisioning costs, computer systems support, costs to support
our outsourcing contracts and technical facilities, contributions to the
universal service fund, and cost of products sold. Aggregate customer
care costs, which include billing and service provisioning, are allocated
between Cost of services and sales and Selling, general and administra-
tive expense.
Cost of services and sales in 2009 decreased by $130 million, or 0.5%,
compared to 2008. The decreases were primarily due to lower costs asso-
ciated with compensation, installation, repair and maintenance expenses
as a result of fewer access lines, lower headcount and productivity
improvements. Also contributing to the decreases were lower long dis-
tance MOUs and customer premise equipment costs, as well as favorable
foreign exchange movements. Partially offsetting these decreases were
higher content and customer acquisition costs associated with continued
subscriber growth. Our FiOS TV and FiOS Internet cost of acquisition per
addition also decreased in 2009, compared to 2008.