Verizon Wireless 2009 Annual Report Download - page 49
Download and view the complete annual report
Please find page 49 of the 2009 Verizon Wireless annual report below. You can navigate through the pages in the report by either clicking on the pages listed below, or by using the keyword search tool below to find specific information within the annual report.-
 1
1 -
2
-
3
-
4
-
5
-
6
-
7
-
8
-
9
-
10
-
11
-
12
-
13
-
14
-
15
-
16
-
17
-
18
-
19
-
20
-
21
-
22
-
23
-
24
-
25
-
26
-
27
-
28
-
29
-
30
-
31
-
32
-
33
-
34
-
35
-
36
-
37
-
38
-
 39
39 -
 40
40 -
 41
41 -
 42
42 -
 43
43 -
 44
44 -
 45
45 -
 46
46 -
 47
47 -
 48
48 -
 49
49 -
 50
50 -
 51
51 -
 52
52 -
 53
53 -
 54
54 -
 55
55 -
 56
56 -
 57
57 -
 58
58 -
 59
59 -
60
-
61
-
62
-
63
-
64
-
65
-
66
-
67
-
68
-
69
-
70
-
71
-
72
-
73
-
74
-
75
-
76
-
77
-
78
-
79
-
80
 |
 |

Notes to Consolidated Financial Statements continued
47
Advertising Costs
Costs for advertising products and services as well as other promotional
and sponsorship costs are charged to Selling, general and administrative
expense in the periods in which they are incurred (see Note 16).
Earnings Per Common Share
Basic earnings per common share are based on the weighted-average
number of shares outstanding during the period. Where appropriate,
diluted earnings per common share include the dilutive effect of shares
issuable under our stock-based compensation plans.
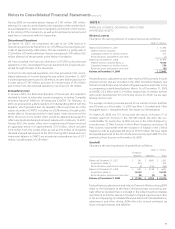
Dilutive stock options outstanding to purchase shares included in the
computation of diluted earnings per common share for the years ended
December 31, 2009 were not significant. There were approximately 1 mil-
lion and 4 million weighted-average dilutive shares, respectively, included
in the computation of diluted earnings per common share for the years
ended December 31, 2008 and 2007. Outstanding options to purchase
shares that were not included in the computation of diluted earnings per
common share because to do so would have been anti-dilutive for the
period, including approximately 112 million, 158 million and 170 million
weighted-average shares for the years ended December 31, 2009, 2008
and 2007 respectively.
We are authorized to issue up to 4.25 billion and 250 million shares of
common stock and Series Preferred Stock, respectively.
Cash and Cash Equivalents
We consider all highly liquid investments with a maturity of 90 days or
less when purchased to be cash equivalents. Cash equivalents are stated
at cost, which approximates market value and include amounts held in
money market funds.
Marketable Securities
We have investments in marketable securities which are considered “avail-
able-for-sale” under the provisions of the accounting standard for certain
debt and equity securities. Marketable securities are included in the
accompanying consolidated balance sheets in Short-term investments,
Investments in unconsolidated businesses or Other assets. We continu-
ally evaluate our investments in marketable securities for impairment
due to declines in market value considered to be other-than-temporary.
That evaluation includes, in addition to persistent, declining stock prices,
general economic and company-specific evaluations. In the event of a
determination that a decline in market value is other-than-temporary, a
charge to earnings is recorded for the loss, and a new cost basis in the
investment is established.
Inventories
Inventory consists primarily of wireless and wireline equipment held for
sale, which is carried at the lower of cost (determined principally on either
an average cost or first-in, first-out basis) or market. We also include in
inventory new and reusable supplies and network equipment of our local
telephone operations, which are stated principally at average original cost,
except that specific costs are used in case of large individual items.
Plant and Depreciation
We record plant, property and equipment at cost. Our local telephone
operations’ depreciation expense is principally based on the composite
group remaining life method and straight-line composite rates. This
method provides for the recognition of the cost of the remaining net
investment in local telephone plant, less anticipated net salvage value,
over the remaining asset lives. This method requires the periodic revision
of depreciation rates.
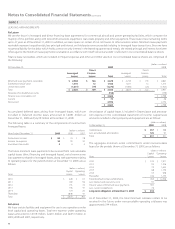
Plant, property and equipment of other wireline and wireless operations
are generally depreciated on a straight-line basis. The asset lives used by
our operations are presented in the following table:
Average Useful Lives (in years)
Buildings 15 – 45
Central office and other network equipment 3 – 15
Outside communications plant
Copper cable 15
Fiber cable (including undersea cable) 11 – 25
Poles, conduit and other 30 – 50
Furniture, vehicles and other 2 – 20
When we replace, retire or otherwise dispose of depreciable plant used
in our local telephone network, we deduct the carrying amount of such
plant from the respective accounts and charge it to accumulated depre-
ciation. When the depreciable assets of our other wireline and wireless
operations are retired or otherwise disposed of, the related cost and
accumulated depreciation are deducted from the plant accounts, and
any gains or losses on disposition are recognized in income.
We capitalize and depreciate network software purchased or developed
along with related plant assets. We also capitalize interest associated with
the acquisition or construction of network-related assets. Capitalized
interest is reported and depreciated as part of the cost of the network-
related assets and as a reduction in interest expense.
In connection with our ongoing review of the estimated remaining
average useful lives of plant, property and equipment, we determined
that there were no changes necessary to average useful lives for 2010.
We determined effective January 1, 2009 that the average useful lives of
fiber cable (not including undersea cable) would be increased to 25 years
from 20 to 25 years and the average useful lives of copper cable would
be changed to 15 years from 13 to 18 years. These changes did not have
a significant impact on depreciation expense. Effective January 1, 2008
the average useful lives of fiber cable was increased from 20 years to 20
to 25 years. This change did not result in a significant impact to deprecia-
tion expense. While the timing and extent of current deployment plans
are subject to ongoing analysis and modification, we believe the current
estimates of useful lives are reasonable.
Computer Software Costs
We capitalize the cost of internal-use network and non-network software,
which has a useful life in excess of one year. Subsequent additions, modi-
fications or upgrades to internal-use network and non-network software
are capitalized only to the extent that they allow the software to perform
a task it previously did not perform. Software maintenance and training
costs are expensed in the period in which they are incurred. Also, we cap-
italize interest associated with the development of internal-use network
and non-network software. Capitalized non-network internal-use soft-
ware costs are amortized using the straight-line method over a period
of 2 to 7 years and are included in Other intangible assets, net in our
consolidated balance sheets. For a discussion of our impairment policy
for capitalized software costs, see “Goodwill and Other Intangible Assets”
below. Also, see Note 4 for additional detail of internal-use non-network
software reflected in our consolidated balance sheets.