Verizon Wireless 2009 Annual Report Download - page 74
Download and view the complete annual report
Please find page 74 of the 2009 Verizon Wireless annual report below. You can navigate through the pages in the report by either clicking on the pages listed below, or by using the keyword search tool below to find specific information within the annual report.-
 1
1 -
2
-
3
-
4
-
5
-
6
-
7
-
8
-
9
-
10
-
11
-
12
-
13
-
14
-
15
-
16
-
17
-
18
-
19
-
20
-
21
-
22
-
23
-
24
-
25
-
26
-
27
-
28
-
29
-
30
-
31
-
32
-
33
-
34
-
35
-
36
-
37
-
38
-
39
-
40
-
41
-
42
-
43
-
44
-
45
-
46
-
47
-
48
-
49
-
50
-
51
-
52
-
53
-
54
-
55
-
56
-
57
-
58
-
59
-
60
-
61
-
62
-
63
-
 64
64 -
 65
65 -
 66
66 -
 67
67 -
 68
68 -
 69
69 -
 70
70 -
 71
71 -
 72
72 -
 73
73 -
 74
74 -
 75
75 -
 76
76 -
 77
77 -
 78
78 -
 79
79 -
 80
80
 |
 |

72
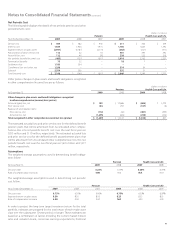
Notes to Consolidated Financial Statements continued
NOTE 16
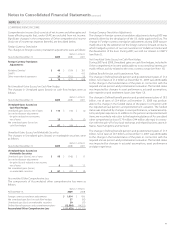
ADDITIONAL FINANCIAL INFORMATION
The tables that follow provide additional financial information related to our consolidated financial statements:
Income Statement Information
(dollars in millions)
Years Ended December 31, 2009 2008 2007
Depreciation expense $ 14,562 $ 13,182 $ 13,036
Interest cost incurred 4,029 2,566 2,258
Capitalized interest (927) (747) (429)
Advertising costs 3,020 2,754 2,463
Balance Sheet Information
(dollars in millions)
Years Ended December 31, 2009 2008
Accounts Payable and Accrued Liabilities
Accounts payable $ 4,337 $ 3,856
Accrued expenses 3,486 2,299
Accrued vacation, salaries and wages 5,084 4,871
Interest payable 872 652
Taxes payable 1,444 2,136
$ 15,223 $ 13,814
Other Current Liabilities
Advance billings and customer deposits $ 2,644 $ 2,651
Dividends payable 1,372 1,334
Other 2,692 3,114
$ 6,708 $ 7,099
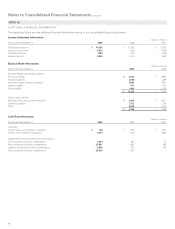
Cash Flow Information
(dollars in millions)
Years Ended December 31, 2009 2008 2007
Cash Paid
Income taxes, net of amounts refunded $ 158 $ 1,206 $ 2,491
Interest, net of amounts capitalized 2,573 1,664 1,682
Supplemental Investing and Financing Transactions
Cash acquired in business combinations 1,044 397 17
Assets acquired in business combinations 35,861 2,800 589
Liabilities assumed in business combinations 6,865 376 154
Debt assumed in business combinations 23,929 1,505 –