Verizon Wireless 2009 Annual Report Download - page 20
Download and view the complete annual report
Please find page 20 of the 2009 Verizon Wireless annual report below. You can navigate through the pages in the report by either clicking on the pages listed below, or by using the keyword search tool below to find specific information within the annual report.-
 1
1 -
2
-
3
-
4
-
5
-
6
-
7
-
8
-
9
-
 10
10 -
 11
11 -
 12
12 -
 13
13 -
 14
14 -
 15
15 -
 16
16 -
 17
17 -
 18
18 -
 19
19 -
 20
20 -
 21
21 -
 22
22 -
 23
23 -
 24
24 -
 25
25 -
 26
26 -
 27
27 -
 28
28 -
 29
29 -
 30
30 -
31
-
32
-
33
-
34
-
35
-
36
-
37
-
38
-
39
-
40
-
41
-
42
-
43
-
44
-
45
-
46
-
47
-
48
-
49
-
50
-
51
-
52
-
53
-
54
-
55
-
56
-
57
-
58
-
59
-
60
-
61
-
62
-
63
-
64
-
65
-
66
-
67
-
68
-
69
-
70
-
71
-
72
-
73
-
74
-
75
-
76
-
77
-
78
-
79
-
80
 |
 |

2009 Compared to 2008
Cost of Services and Sales
Cost of services and sales includes the following costs directly attribut-
able to a service or product: salaries and wages, benefits, materials and
supplies, contracted services, network access and transport costs, wire-
less equipment costs, customer provisioning costs, computer systems
support, costs to support our outsourcing contracts and technical facili-
ties and contributions to the universal service fund. Aggregate customer
care costs, which include billing and service provisioning, are allocated
between Cost of services and sales and Selling, general and administra-
tive expense.
Consolidated cost of services and sales during 2009 increased by $5,292
million, or 13.6%, compared to 2008, primarily due to higher wireless
network costs, including the effects of operating an expanded wire-
less network as a result of the acquisition of Alltel, and increased costs
of equipment. Additionally, we experienced increased costs associated
with our growth businesses including higher content and customer
acquisition costs. Also contributing to the increase were an increase in
the numbers of both data and phone equipment units sold as well as an
increase in the average cost per equipment unit. Partially offsetting these
increases were reduced roaming costs realized by moving more traffic
to our own network as a result of the acquisition of Alltel and declines
due in part to lower headcount and productivity improvements at our
Wireline segment.
Consolidated cost of services and sales during 2009 included $195 mil-
lion for merger integration and acquisition costs primarily related to the
Alltel acquisition, and $38 million for costs incurred related to preparing
the separation of the wireline facilities and operations in the markets to
be divested in the transaction with Frontier.
Consolidated cost of services and sales in 2009 and 2008 included $1,444
million and $65 million, respectively, for severance, pension and benefits
charges.
Consolidated cost of services and sales in 2008 include $24 million of
costs primarily associated with the integration of MCI into our wireline
business. Consolidated cost of services and sales expense during 2008
also included $16 million related to the spin-off of local exchange and
related business assets in Maine, New Hampshire and Vermont.
Selling, General and Administrative Expense
Selling, general and administrative expense includes salaries and wages
and benefits not directly attributable to a service or product, bad debt
charges, taxes other than income taxes, advertising and sales commis-
sion costs, customer billing, call center and information technology costs,
professional service fees and rent and utilities for administrative space.
Consolidated selling, general and administrative expense in 2009
increased by $6,052 million, or 22.5%, compared to 2008. This increase
was primarily due to increased wireless salary and benefits as a result of a
larger employee base after the acquisition of Alltel and higher sales com-
mission in our indirect channel in Domestic Wireless, partially offset by
the impact of cost reduction initiatives in our Wireline segment.
Consolidated selling, general and administrative expense in 2009 included
$2,602 million, for severance, pension and benefits charges. Consolidated
selling, general and administrative expense in 2009 also included $442
million, primarily for merger integration and acquisition costs related to
the acquisition of Alltel, as well as $415 million for costs incurred related
to our Wireline cost reduction initiatives and costs to enable the mar-
kets to be divested to operate on a stand-alone basis subsequent to the
closing of the transaction with Frontier.
Consolidated selling, general and administrative expense in 2008 included
$885 million for severance and severance-related costs as well as pen-
sion settlement losses. Consolidated selling, general and administrative
expense also included $150 million for merger integration costs, primarily
related to the former MCI system integration activities and $87 million
related to the spin-off of local exchange and related business assets in
Maine, New Hampshire and Vermont.
Depreciation and Amortization Expense
Depreciation and amortization expense in 2009 increased by $1,967
million, or 13.5%, compared to 2008. This increase was mainly driven by
depreciable property and equipment and finite-lived intangible assets
acquired from Alltel which are not being divested, as well as growth in
depreciable plant from capital spending partially offset by lower rates of
depreciation. Depreciation and amortization expense in 2009 included
$317 million of merger integration costs related to the Alltel acquisition.
2008 Compared to 2007
Cost of Services and Sales
Consolidated cost of services and sales in 2008 increased by $1,460 mil-
lion, or 3.9%, compared to 2007, primarily as a result of higher wireless
network costs and wireless equipment costs. The increase was partially
offset by the impact of productivity improvement initiatives and lower
cost of services and sales driven by a decline in switched access lines
in service and wholesale voice connections. The higher wireless network
costs in 2008 were primarily caused by increased network usage for voice
and data services, increased roaming, increased use of data services and
applications and increased payments related to network leases. Cost of
wireless equipment increased in 2008 compared to 2007 primarily as a
result of an increase in the number of equipment upgrades by customers,
combined with an increase in average equipment cost per device as a
result of an increase in the sale of higher-cost advanced wireless devices.
The increase in cost of services and sales was also impacted by unfavor-
able foreign exchange rates, higher utility costs and the inclusion of the
results of operations of a security services firm acquired on July 1, 2007.
Consolidated cost of services and sales in 2008 and 2007 included $24
million and $32 million, respectively, of costs primarily associated with
the integration of MCI into our wireline business. Consolidated cost of ser-
vices and sales in 2008 also included $16 million related to the spin-off of
local exchange and related business assets in Maine, New Hampshire and
Vermont and $65 million for severance, pension and benefits charges.
18
Management’s Discussion and Analysis
of Financial Condition and Results of Operations continued
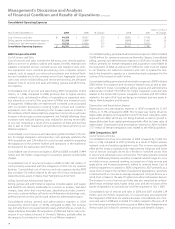
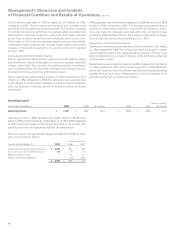
Consolidated Operating Expenses
(dollars in millions)
Years Ended December 31, 2009 2008 % Change 2008 2007 % Change
Cost of services and sales $ 44,299 $ 39,007 13.6 $ 39,007 $ 37,547 3.9
Selling, general and administrative expense 32,950 26,898 22.5 26,898 25,967 3.6
Depreciation and amortization expense 16,532 14,565 13.5 14,565 14,377 1.3
Consolidated Operating Expenses $ 93,781 $ 80,470 16.5 $ 80,470 $ 77,891 3.3