Verizon Wireless 2009 Annual Report Download - page 21
Download and view the complete annual report
Please find page 21 of the 2009 Verizon Wireless annual report below. You can navigate through the pages in the report by either clicking on the pages listed below, or by using the keyword search tool below to find specific information within the annual report.-
 1
1 -
2
-
3
-
4
-
5
-
6
-
7
-
8
-
9
-
10
-
 11
11 -
 12
12 -
 13
13 -
 14
14 -
 15
15 -
 16
16 -
 17
17 -
 18
18 -
 19
19 -
 20
20 -
 21
21 -
 22
22 -
 23
23 -
 24
24 -
 25
25 -
 26
26 -
 27
27 -
 28
28 -
 29
29 -
 30
30 -
 31
31 -
32
-
33
-
34
-
35
-
36
-
37
-
38
-
39
-
40
-
41
-
42
-
43
-
44
-
45
-
46
-
47
-
48
-
49
-
50
-
51
-
52
-
53
-
54
-
55
-
56
-
57
-
58
-
59
-
60
-
61
-
62
-
63
-
64
-
65
-
66
-
67
-
68
-
69
-
70
-
71
-
72
-
73
-
74
-
75
-
76
-
77
-
78
-
79
-
80
 |
 |

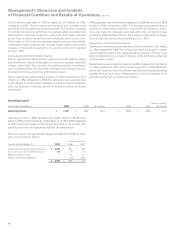
Selling, General and Administrative Expense
Consolidated selling, general and administrative expense in 2008 increased
by $931 million, or 3.6%, compared to 2007. The increase resulted from an
increase in sales commission expense, bad debt expense and advertising
and promotions costs, partially offset by a decrease in salary and benefits
related expense and the impact of productivity initiatives.
Consolidated selling, general and administrative expense in 2008
included $885 million for severance, pension and benefits charges, $150
million for merger integration costs, primarily comprised of systems inte-
gration activities related to businesses acquired and $87 million related
to the spin-off of local exchange and related business assets in Maine,
New Hampshire and Vermont.
19
Management’s Discussion and Analysis
of Financial Condition and Results of Operations continued
Other income and (expense), net in 2009 decreased by $192 million
compared to 2008. The decrease was primarily driven by lower interest
income, in part due to lower invested balances in the current year. The
$4.8 billion investment in Alltel debt obligations acquired in 2008 was
eliminated in consolidation beginning in January 2009, subsequent to
the close of the Alltel transaction.
Consolidated selling, general and administrative expense in 2007
included charges of $772 million for severance and related expenses,
$146 million for merger integration costs, primarily comprised of sys-
tems integration activities related to businesses acquired and $84 million
related to the spin-off of local exchange and related business assets in
Maine, New Hampshire and Vermont. In addition, during 2007 we con-
tributed $100 million of the proceeds from the sale of our investment
in Telecomunicaciones de Puerto Rico, Inc. (TELPRI) to the Verizon
Foundation.
Depreciation and Amortization Expense
Depreciation and amortization expense in 2008 increased by $188 mil-
lion, or 1.3%, compared to 2007. The increase was primarily driven by
growth in depreciable assets.
Other Consolidated Results
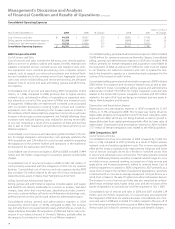
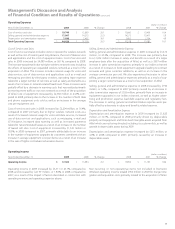
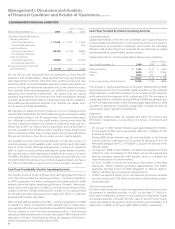
Equity in Earnings of Unconsolidated Businesses (dollars in millions)
Years Ended December 31, 2009 2008 % Change 2008 2007 % Change
Vodafone Omnitel $ 621 $ 655 (5.2) $ 655 $ 597 9.7
Other (68) (88) (22.7) (88) (12) nm
Total $ 553 $ 567 (2.5) $ 567 $ 585 (3.1)
nm – not meaningful
Other Income and (Expense), Net (dollars in millions)
Years Ended December 31, 2009 2008 % Change 2008 2007 % Change
Interest income $ 75 $ 362 (79.3) $ 362 $ 168 nm
Foreign exchange gains (losses), net – (46) (100.0) (46) 14 nm
Other, net 15 (34) nm (34) 29 nm
Total $ 90 $ 282 (68.1) $ 282 $ 211 33.6
nm – not meaningful
Equity in earnings of unconsolidated businesses in 2009 decreased by
$14 million compared to 2008. The decrease was primarily due to higher
income tax benefits recorded at Vodafone Omnitel N.V. (Vodafone
Omnitel) during 2008. Partially offsetting the decrease were higher earn-
ings at Vodafone Omnitel as well as the devaluation of the Euro versus
the U.S. dollar.
Equity in earnings of unconsolidated businesses in 2008 decreased by
$18 million compared to 2007. The decrease was primarily driven by the
gain on the sale of an international investment in 2007, partially offset by
higher earnings at Vodafone Omnitel in 2008.
Other income and (expense), net in 2008 increased by $71 million com-
pared to 2007. The increase was primarily attributable to higher interest
income, primarily from our investment in Alltel’s debt obligations. Partially
offsetting the increase were foreign exchange losses at our international
wireline operations and an impairment charge of $48 million recorded
during the fourth quarter of 2008 related to an other-than-temporary
decline in fair value of our investments in certain marketable securities.