Verizon Wireless 2009 Annual Report Download - page 67
Download and view the complete annual report
Please find page 67 of the 2009 Verizon Wireless annual report below. You can navigate through the pages in the report by either clicking on the pages listed below, or by using the keyword search tool below to find specific information within the annual report.-
 1
1 -
2
-
3
-
4
-
5
-
6
-
7
-
8
-
9
-
10
-
11
-
12
-
13
-
14
-
15
-
16
-
17
-
18
-
19
-
20
-
21
-
22
-
23
-
24
-
25
-
26
-
27
-
28
-
29
-
30
-
31
-
32
-
33
-
34
-
35
-
36
-
37
-
38
-
39
-
40
-
41
-
42
-
43
-
44
-
45
-
46
-
47
-
48
-
49
-
50
-
51
-
52
-
53
-
54
-
55
-
56
-
 57
57 -
 58
58 -
 59
59 -
 60
60 -
 61
61 -
 62
62 -
 63
63 -
 64
64 -
 65
65 -
 66
66 -
 67
67 -
 68
68 -
 69
69 -
 70
70 -
 71
71 -
 72
72 -
 73
73 -
 74
74 -
 75
75 -
 76
76 -
 77
77 -
78
-
79
-
80
 |
 |

Notes to Consolidated Financial Statements continued
65
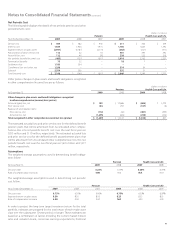
in asset backed securities such as collateralized mortgage obligations,
mortgage backed securities and interest rate swaps. The fair value of
fixed income securities are based on observable prices for identical or
comparable assets, adjusted using benchmark curves, sector grouping,
matrix pricing, broker/dealer quotes and issuer spreads, and are generally
classified within Level 1 or Level 2 in the fair value hierarchy.
Real estate investments include those in limited partnerships that invest
in various commercial and residential real estate projects both domesti-
cally and internationally. The fair values of real estate assets are typically
determined by using income and/or cost approaches or comparable sales
approach, taking into consideration discount and capitalization rates,
financial conditions, local market conditions and the status of the capital
markets, and thus are classified within Level 3 in the fair value hierarchy.
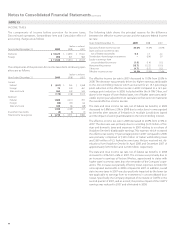
Private equity investments include those in limited partnerships that invest
in operating companies that are not publicly traded on a stock exchange.
Investment strategies in private equity include leveraged buyouts, ven-
ture capital, distressed investments and investments in natural resources.
These investments are valued using inputs such as trading multiples of
comparable public securities, merger and acquisition activity and pricing
data from the most recent equity financing taking into consideration illi-
quidity, and thus are classified within Level 3 in the fair value hierarchy.
Hedge fund investments include those seeking to maximize absolute
returns using a broad range of strategies to enhance returns and provide
additional diversification. The fair values of hedge funds are estimated
using net asset value per share (NAV) of the investments. Verizon has the
ability to redeem these investments at NAV within the near term and
thus are classified within Level 2 of the fair value hierarchy.
Cash Flows
In 2009, we contributed $213 million to our qualified pension plans, $124
million to our nonqualified pension plans and $1,638 million to our other
postretirement benefit plans. We have no material required qualified pen-
sion plan contributions in 2010. We also anticipate approximately $140
million in contributions to our non-qualified pension plans and $1,890
million to our other postretirement benefit plans in 2010.
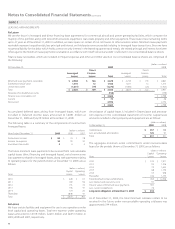
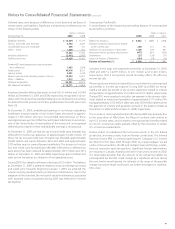
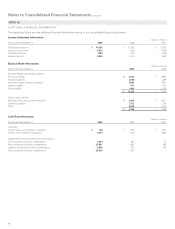
Estimated Future Benefit Payments
The benefit payments to retirees are expected to be paid as follows:
(dollars in millions)
Year
Pension
Benefits
Health Care and Life
Prior to Medicare
Prescription
Drug Subsidy
Expected
Medicare Prescription
Drug Subsidy
2010 $ 5,599 $ 2,076 $99
2011 3,796 2,158 108
2012 2,134 2,169 120
2013 2,206 2,182 130
2014 2,173 2,175 140
2015 – 2019 10,723 10,379 857
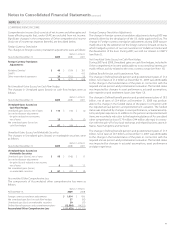
Savings Plan and Employee Stock Ownership Plans
We maintain four leveraged employee stock ownership plans (ESOP).
Only one plan currently has unallocated shares. We match a certain per-
centage of eligible employee contributions to the savings plans with
shares of our common stock from this ESOP. At December 31, 2009, the
number of unallocated and allocated shares of common stock in this
ESOP were 3 million and 68 million, respectively. All leveraged ESOP
shares are included in earnings per share computations.
Total savings plan costs were $725 million, $683 million and $712 million
in 2009, 2008 and 2007, respectively.
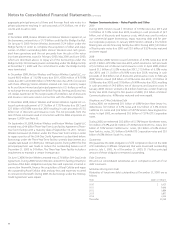
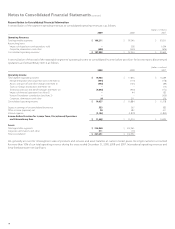
Severance Benefits
The following table provides an analysis of our severance liability recorded
in accordance with the accounting standard regarding employers’
accounting for postemployment benefits:
(dollars in millions)
Year
Beginning
of Year
Charged to
Expense Payments Other End of Year
2007 $ 644 $ 743 $ (363) $ –$ 1,024
2008 1,024 570 (509) 19 1,104
2009 1,104 1,034 (522) 22 1,638
The remaining severance liability is actuarially determined and includes
the impact of the activities described below. The 2009 expense
includes charges for the involuntary separation of approximately 17,600
employees and related charges; 4,200 of whom were separated in late
2009, with the remainder expected to occur in 2010. The 2008 expense
includes charges for the involuntary separation of approximately 8,600
employees, including approximately 3,500 of whom were separated in
the second half of 2008 and the remainder in 2009. The 2007 expense
includes charges for the involuntary separation of 9,000 employees as
described below.
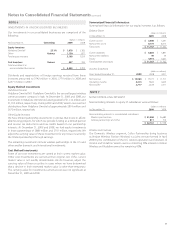
Severance, Pension and Benefit Charges
During 2009, we recorded net pretax severance, pension and benefits
charges of $4,046 million ($2,487 million after-tax). Included in the
charges were net pretax settlement losses of $1,183 million ($719 mil-
lion after-tax) related to employees that received lump-sum distributions,
primarily resulting from our previous separation plans, as prescribed
payment thresholds were reached. Additionally, we recorded net pretax
pension and postretirement curtailment losses of $1,810 million ($1,100
million after-tax) as workforce reductions caused the elimination of a sig-
nificant amount of future service requiring us to recognize a portion of
the prior service costs and actuarial losses. These charges also included
$1,053 million ($668 million after-tax) for planned workforce reductions of
approximately 17,600 employees, 4,200 of which occurred in late 2009.
During 2008, we recorded net pretax severance, pension and benefits
charges of $950 million ($588 million after-tax). These charges primarily
included $586 million ($363 million after-tax) for workforce reductions in
connection with the separation of approximately 8,600 employees and
related charges; 3,500 of whom were separated in the second half of 2008
and the remainder in 2009. Also included are net pretax pension settle-
ments losses of $364 million ($225 million after-tax) related to employees
that received lump-sum distributions, primarily resulting from our separa-
tion plans in which prescribed payment thresholds have been reached.
During the fourth quarter of 2007, we recorded charges of $772 million
($477 million after-tax) primarily in connection with workforce reductions
of 9,000 employees and related charges, 4,000 of whom were separated
in the fourth quarter of 2007 with the remaining reductions occurring
throughout 2008. In addition, we adjusted our actuarial assumptions for
severance to align with future expectations.