Verizon Wireless 2009 Annual Report Download - page 19
Download and view the complete annual report
Please find page 19 of the 2009 Verizon Wireless annual report below. You can navigate through the pages in the report by either clicking on the pages listed below, or by using the keyword search tool below to find specific information within the annual report.-
 1
1 -
2
-
3
-
4
-
5
-
6
-
7
-
8
-
 9
9 -
 10
10 -
 11
11 -
 12
12 -
 13
13 -
 14
14 -
 15
15 -
 16
16 -
 17
17 -
 18
18 -
 19
19 -
 20
20 -
 21
21 -
 22
22 -
 23
23 -
 24
24 -
 25
25 -
 26
26 -
 27
27 -
 28
28 -
 29
29 -
30
-
31
-
32
-
33
-
34
-
35
-
36
-
37
-
38
-
39
-
40
-
41
-
42
-
43
-
44
-
45
-
46
-
47
-
48
-
49
-
50
-
51
-
52
-
53
-
54
-
55
-
56
-
57
-
58
-
59
-
60
-
61
-
62
-
63
-
64
-
65
-
66
-
67
-
68
-
69
-
70
-
71
-
72
-
73
-
74
-
75
-
76
-
77
-
78
-
79
-
80
 |
 |

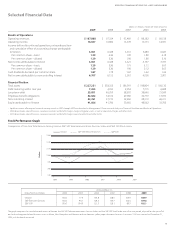
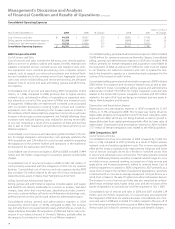
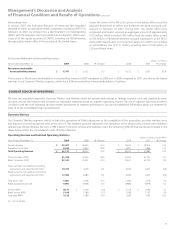
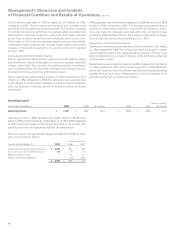
Consolidated Revenues
(dollars in millions)
Years Ended December 31, 2009 2008 % Change 2008 2007 % Change
Domestic Wireless
Service revenue $ 53,497 $42,635 25.5 $42,635 $38,016 12.2
Equipment and other 8,634 6,697 28.9 6,697 5,866 14.2
Total 62,131 49,332 25.9 49,332 43,882 12.4
Wireline
Mass Markets 19,755 19,799 (0.2) 19,799 19,570 1.2
Global Enterprise 14,988 15,779 (5.0) 15,779 15,710 0.4
Global Wholesale 9,637 10,360 (7.0) 10,360 10,750 (3.6)
Other 1,700 2,276 (25.3) 2,276 3,099 (26.6)
Total 46,080 48,214 (4.4) 48,214 49,129 (1.9)
Corporate, eliminations and other (403) (192) nm (192) 458 nm
Consolidated Revenues $ 107,808 $97,354 10.7 $97,354 $93,469 4.2
nm – not meaningful
2008 Compared to 2007
Consolidated revenues in 2008 increased by $3,885 million, or 4.2%, com-
pared to 2007. This increase was primarily the result of continued strong
growth at Domestic Wireless.
Domestic Wireless’s revenues in 2008 increased by $5,450 million, or
12.4%, compared to 2007 due to continued strong growth in service rev-
enue. Service revenues during 2008 increased $4,619 million, or 12.2%,
compared to 2007 primarily due to an increase in data revenue and a
6.3 million or 9.7% increase in total customers. Total data revenue was
$10,651 million and accounted for 25.0% of service revenue in 2008,
compared to $7,386 million and 19.4%, respectively, in 2007, as a result
of an increased number of customers using our data services, as well as
increased usage of our messaging services and non-messaging services,
such as Mobile Broadband, e-mail, data transport and newer location-
based data services such as VZ Navigator.
Equipment and other revenue in 2008 increased by $831 million, or 14.2%,
compared to 2007, primarily as a result of an increase in the number of
upgrades for data devices combined with higher average equipment rev-
enue per device for phones, partially offset by lower average equipment
revenue per device for data devices sold through our direct channel.
Wireline’s revenues in 2008 decreased by $915 million, or 1.9%, compared
to 2007, primarily driven by declines in Other and Global Wholesale rev-
enues partially offset by increases in Mass Markets and Global Enterprise
revenues.
Global Wholesale revenues during 2008 decreased by $390 million, or
3.6%, compared to 2007, due to declines in switched access revenues in
traditional voice products and local wholesale revenues, decreased MOUs
in traditional voice products and continued rate compression in the mar-
ketplace. This decrease was partially offset by an increase in special access
revenues. Mass Markets revenues during 2008 increased $229 million, or
1.2%, compared to 2007, primarily due to continued growth in FiOS ser-
vices, partially offset by a continued decline of local exchange revenues
principally as a result of switched access line losses. Global Enterprise
revenues increased $69 million, or 0.4%, during 2008 compared to 2007,
primarily due to an increase in IP and security solutions revenues partially
offset by lower long distance and traditional circuit-based data revenues,
combined with the negative effects of movements in foreign exchange
rates versus the U.S. dollar. Other revenue in 2008 decreased $823 mil-
lion, or 26.6%, compared to the similar period in 2007, primarily due to
the discontinuation of non-strategic product lines and reduced business
volumes, including former MCI mass markets customer losses.
2009 Compared to 2008
Consolidated revenues in 2009 increased by $10,454 million, or 10.7%,
compared to the similar period in 2008, primarily due to the inclusion
of the operating results of Alltel in our Wireless segment and higher
revenues in our growth markets. These revenue increases were partially
offset by declines in revenues at our Wireline segment due to switched
access line losses and decreased minutes of use (MOUs) in traditional
voice products.
Domestic Wireless’s revenues in 2009 increased by $12,799 million, or
25.9%, compared to the similar period in 2008, primarily due to the inclu-
sion of the operating results of Alltel and continued growth in service
revenue. Service revenue in 2009 increased $10,862 million, compared
to the similar period in 2008 primarily as a result of the 13.2 million net
new customers, after conforming adjustments, which we acquired in
connection with the acquisition of Alltel on January 9, 2009, as well as a
5.9 million, or 8.2%, increase in total customers from sources other than
acquisitions. Total data revenue was $16,014 million and accounted for
29.9% of service revenue in 2009, compared to $10,651 million and 25.0%,
respectively, during the similar period in 2008 because of increased use
of Mobile Broadband, e-mail, and messaging.
Domestic Wireless’s equipment and other revenue in 2009 increased by
$1,937 million, or 28.9%, compared to the similar period in 2008, primarily
due to an increase in gross customer additions as well as an increase in
the number of units sold to existing customers upgrading their wireless
devices. Other revenues increased primarily due to the inclusion of the
operating results of Alltel and an increase in our cost recovery rate.
Wireline’s revenues in 2009 decreased by $2,134 million, or 4.4%, com-
pared to the similar period in 2008. Mass Markets revenues in 2009
decreased $44 million, or 0.2%, compared to the similar period in 2008,
primarily due to continued decline of local exchange revenues principally
as a result of switched access line losses, partially offset by a continued
growth in FiOS services. Global Enterprise revenues in 2009 decreased by
$791 million, or 5.0%, compared to the similar period in 2008, primarily
due to lower long distance and traditional circuit-based data revenues,
and lower customer premise equipment combined with the negative
effects of movements in foreign exchange rates versus the U.S. dollar. This
decrease was offset partially by an increase in IP and security solutions
revenues. Global Wholesale revenues in 2009 decreased $723 million, or
7.0%, compared to the similar period in 2008, due to decreased MOUs in
traditional voice products and continued rate compression due to com-
petition in the marketplace.
17
Management’s Discussion and Analysis
of Financial Condition and Results of Operations continued