Verizon Wireless 2009 Annual Report Download - page 25
Download and view the complete annual report
Please find page 25 of the 2009 Verizon Wireless annual report below. You can navigate through the pages in the report by either clicking on the pages listed below, or by using the keyword search tool below to find specific information within the annual report.-
 1
1 -
2
-
3
-
4
-
5
-
6
-
7
-
8
-
9
-
10
-
11
-
12
-
13
-
14
-
 15
15 -
 16
16 -
 17
17 -
 18
18 -
 19
19 -
 20
20 -
 21
21 -
 22
22 -
 23
23 -
 24
24 -
 25
25 -
 26
26 -
 27
27 -
 28
28 -
 29
29 -
 30
30 -
 31
31 -
 32
32 -
 33
33 -
 34
34 -
 35
35 -
36
-
37
-
38
-
39
-
40
-
41
-
42
-
43
-
44
-
45
-
46
-
47
-
48
-
49
-
50
-
51
-
52
-
53
-
54
-
55
-
56
-
57
-
58
-
59
-
60
-
61
-
62
-
63
-
64
-
65
-
66
-
67
-
68
-
69
-
70
-
71
-
72
-
73
-
74
-
75
-
76
-
77
-
78
-
79
-
80
 |
 |

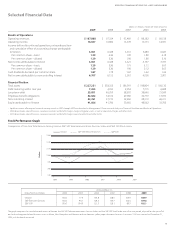
23
Selling, General and Administrative Expense
Selling, general and administrative expense in 2009 increased by $3,574
million, or 25.0%, compared to 2008. This increase was primarily due
to a $1,052 million increase in salary and benefits as a result of a larger
employee base after the acquisition of Alltel, as well as a $997 million
increase in sales commission expense, primarily in our indirect channel
as a result of increases in both equipment upgrades leading to contract
renewals and gross customer additions, as well as an increase in the
average commission per unit. We also experienced increases in other
selling, general and administrative expenses primarily as a result of sup-
porting a larger customer base as a result of our acquisition of Alltel.
Selling, general and administrative expense in 2008 increased by $796
million, or 5.9%, compared to 2007 primarily caused by an increase in
sales commission expense of $302 million, primarily from an increase in
equipment upgrades in our indirect channel, as well as higher adver-
tising and promotion expense, bad debt expense and regulatory fees.
The increases in selling, general and administrative expense were par-
tially offset by a decrease in salary and benefits related expense.
Depreciation and Amortization Expense
Depreciation and amortization expense in 2009 increased by $1,625
million, or 30.1%, compared to 2008 primarily driven by depreciable
property and equipment and finite-lived intangible assets acquired from
Alltel which are not being divested, including its customer lists, as well as
growth in depreciable assets during 2009.
Depreciation and amortization expense increased by $251 million, or
4.9%, in 2008 compared to 2007, primarily caused by an increase in
depreciable assets.
Management’s Discussion and Analysis
of Financial Condition and Results of Operations continued
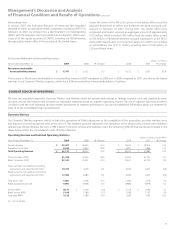
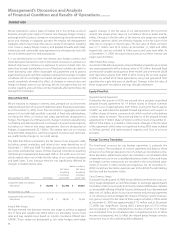
Operating Income (dollars in millions)
Years Ended December 31, 2009 2008 % Change 2008 2007 % Change
Operating Income $ 17,505 $ 13,994 25.1 $ 13,994 $ 11,795 18.6
Operating income in 2009 increased by $3,511 or 25.1%, compared to
2008 and increased by $2,199 million, or 18.6%, in 2008 compared to
2007, as a result of the impact of factors described in connection with
operating revenue and operating expenses above.
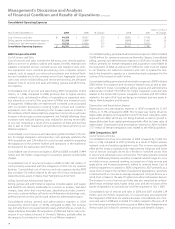
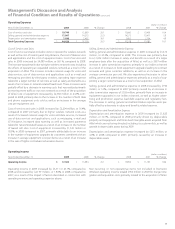
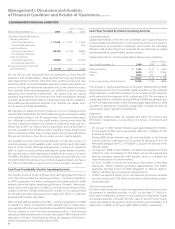
Operating Expenses (dollars in millions)
Years Ended December 31, 2009 2008 % Change 2008 2007 % Change
Cost of services and sales $ 19,749 $ 15,660 26.1 $ 15,660 $ 13,456 16.4
Selling, general and administrative expense 17,847 14,273 25.0 14,273 13,477 5.9
Depreciation and amortization expense 7,030 5,405 30.1 5,405 5,154 4.9
Total Operating Expenses $ 44,626 $ 35,338 26.3 $ 35,338 $ 32,087 10.1
Cost of Services and Sales
Cost of services and sales includes costs to operate the wireless network
as well as the cost of roaming and long distance, the cost of data services
and applications and the cost of equipment sales. Cost of services and
sales in 2009 increased by $4,089 million, or 26.1%, compared to 2008.
The increase was primarily due to higher wireless network costs, including
the effects of operating an expanded wireless network as a result of the
acquisition of Alltel. This increase includes network usage for voice and
data services, use of data services and applications such as e-mail and
messaging provided by third party vendors, operating lease expense
related to a larger number of cell sites, as well as salary and benefits as a
result of an increase in network-related headcount. These increases were
partially offset by a decrease in roaming costs that was realized primarily
by moving more traffic to our own network as a result of the acquisition
of Alltel. Cost of equipment increased by $2,382 million or 24.5% com-
pared to 2008, primarily due to the increase in the number of both data
and phone equipment units sold as well as an increase in the average
cost per equipment unit.
Cost of services and sales in 2008 increased by $2,204 million, or 16.4%,
compared to 2007 primarily due to higher wireless network costs as a
result of increased network usage for voice and data services, increased
use of data services and applications, such as messaging, e-mail and
VZ Navigator, increased data roaming as well as increased payments
related to network-related leases as a result of an increase in the number
of leased cell sites. Cost of equipment increased by $1,543 million or
18.9%, in 2008 compared to 2007, primarily attributable to an increase
in the number of equipment upgrades by customers combined with an
increase in average equipment cost per device as a result of an increase
in the sale of higher-cost advanced wireless devices.
Non-recurring or non-operational items not included in Domestic
Wireless’s operating income totaled $954 million in 2009 for merger inte-
gration and acquisition costs primarily related to the acquisition of Alltel.