Verizon Wireless 2009 Annual Report Download - page 71
Download and view the complete annual report
Please find page 71 of the 2009 Verizon Wireless annual report below. You can navigate through the pages in the report by either clicking on the pages listed below, or by using the keyword search tool below to find specific information within the annual report.-
 1
1 -
2
-
3
-
4
-
5
-
6
-
7
-
8
-
9
-
10
-
11
-
12
-
13
-
14
-
15
-
16
-
17
-
18
-
19
-
20
-
21
-
22
-
23
-
24
-
25
-
26
-
27
-
28
-
29
-
30
-
31
-
32
-
33
-
34
-
35
-
36
-
37
-
38
-
39
-
40
-
41
-
42
-
43
-
44
-
45
-
46
-
47
-
48
-
49
-
50
-
51
-
52
-
53
-
54
-
55
-
56
-
57
-
58
-
59
-
60
-
 61
61 -
 62
62 -
 63
63 -
 64
64 -
 65
65 -
 66
66 -
 67
67 -
 68
68 -
 69
69 -
 70
70 -
 71
71 -
 72
72 -
 73
73 -
 74
74 -
 75
75 -
 76
76 -
 77
77 -
 78
78 -
 79
79 -
 80
80
 |
 |

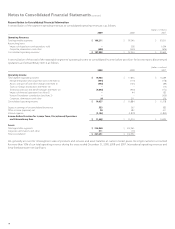
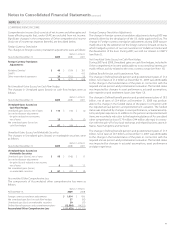
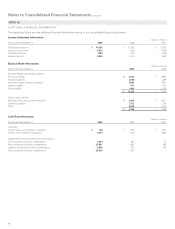
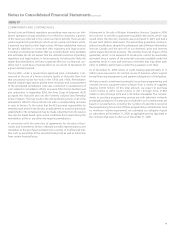
Notes to Consolidated Financial Statements continued
69
(dollars in millions)
2008 Domestic Wireless Wireline Total Segments
External Operating Revenues
Service revenue $ 42,560 $ – $ 42,560
Equipment and other 6,666 – 6,666
Mass Markets – 19,785 19,785
Global Enterprise – 15,777 15,777
Global Wholesale – 9,240 9,240
Other – 2,176 2,176
Intersegment revenues 106 1,236 1,342
Total operating revenues 49,332 48,214 97,546
Cost of services and sales 15,660 24,274 39,934
Selling, general and administrative expense 14,273 11,047 25,320
Depreciation and amortization expense 5,405 9,031 14,436
Total operating expenses 35,338 44,352 79,690
Operating income $ 13,994 $ 3,862 $ 17,856
Assets $ 111,979 $ 90,386 $ 202,365
Plant, property and equipment, net 27,136 58,287 85,423
Capital expenditures 6,510 9,797 16,307
(dollars in millions)
2007 Domestic Wireless Wireline Total Segments
External Operating Revenues
Service revenue $ 37,951 $ – $ 37,951
Equipment and other 5,826 – 5,826
Mass Markets – 19,541 19,541
Global Enterprise – 15,712 15,712
Global Wholesale – 9,638 9,638
Other – 2,998 2,998
Intersegment revenues 105 1,240 1,345
Total operating revenues 43,882 49,129 93,011
Cost of services and sales 13,456 24,181 37,637
Selling, general and administrative expense 13,477 11,527 25,004
Depreciation and amortization expense 5,154 8,927 14,081
Total operating expenses 32,087 44,635 76,722
Operating income $ 11,795 $ 4,494 $ 16,289
Assets $ 83,755 $ 92,264 $ 176,019
Plant, property and equipment, net 25,971 58,702 84,673
Capital expenditures 6,503 10,956 17,459