Verizon Wireless 2009 Annual Report Download - page 65
Download and view the complete annual report
Please find page 65 of the 2009 Verizon Wireless annual report below. You can navigate through the pages in the report by either clicking on the pages listed below, or by using the keyword search tool below to find specific information within the annual report.-
 1
1 -
2
-
3
-
4
-
5
-
6
-
7
-
8
-
9
-
10
-
11
-
12
-
13
-
14
-
15
-
16
-
17
-
18
-
19
-
20
-
21
-
22
-
23
-
24
-
25
-
26
-
27
-
28
-
29
-
30
-
31
-
32
-
33
-
34
-
35
-
36
-
37
-
38
-
39
-
40
-
41
-
42
-
43
-
44
-
45
-
46
-
47
-
48
-
49
-
50
-
51
-
52
-
53
-
54
-
 55
55 -
 56
56 -
 57
57 -
 58
58 -
 59
59 -
 60
60 -
 61
61 -
 62
62 -
 63
63 -
 64
64 -
 65
65 -
 66
66 -
 67
67 -
 68
68 -
 69
69 -
 70
70 -
 71
71 -
 72
72 -
 73
73 -
 74
74 -
 75
75 -
76
-
77
-
78
-
79
-
80
 |
 |

Notes to Consolidated Financial Statements continued
63
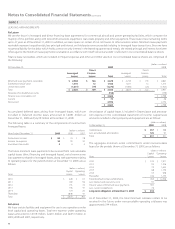
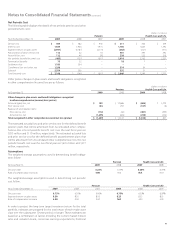
Net Periodic Cost
The following table displays the details of net periodic pension and other
postretirement costs:
(dollars in millions)
Pension Health Care and Life
Years Ended December 31, 2009 2008 2007 2009 2008 2007
Service cost $ 384 $ 382 $ 442 $ 311 $ 306 $ 354
Interest cost 1,924 1,966 1,975 1,766 1,663 1,592
Expected return on plan assets (2,937) (3,187) (3,175) (302) (321) (317)
Amortization of prior service cost 112 62 43 401 395 392
Actuarial loss, net 112 40 98 238 222 316
Net periodic benefit (income) cost (405) (737) (617) 2,414 2,265 2,337
Termination benefits 75 32 – 18 7 –
Settlement loss 1,183 364 ––– –
Curtailment loss and other, net 1,296 – – 514 24 –
Subtotal 2,554 396 – 532 31 –
Total (income) cost $ 2,149 $ (341) $ (617) $ 2,946 $ 2,296 $ 2,337
Other pretax changes in plan assets and benefit obligations recognized
in other comprehensive (income) loss are as follows:
(dollars in millions)
Pension Health Care and Life
At December 31, 2009 2008 2009 2008
Other changes in plan assets and benefit obligations recognized
in other comprehensive (income) loss (pretax)
Actuarial (gain) loss, net $ 199 $ 13,686 $ (804) $ 1,030
Prior service cost (51) 293 (167) (6)
Reversal of amortization items
Prior service cost (112) (62) (401) (395)
Actuarial loss, net (1,295) (404) (238) (222)
Total recognized in other comprehensive (income) loss (pretax) $ (1,259) $ 13,513 $ (1,610) $ 407
The estimated actuarial loss and prior service cost for the defined benefit
pension plans that will be amortized from Accumulated other compre-
hensive loss into net periodic benefit cost over the next fiscal year are
$255 million and $110 million, respectively. The estimated actuarial loss
and prior service cost for the defined benefit postretirement plans that
will be amortized from Accumulated other comprehensive loss into net
periodic benefit cost over the next fiscal year are $235 million and $377
million, respectively.
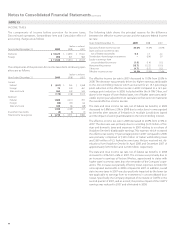
Assumptions
The weighted-average assumptions used in determining benefit obliga-
tions follow:
Pension Health Care and Life
At December 31, 2009 2008 2009 2008
Discount rate 6.25% 6.75% 6.25% 6.75%
Rate of compensation increases 4.00 4.00 N/A N/A
The weighted-average assumptions used in determining net periodic
cost follow:
Pension Health Care and Life
Years Ended December 31, 2009 2008 2007 2009 2008 2007
Discount rate 6.75% 6.50% 6.00% 6.75% 6.50% 6.00%
Expected return on plan assets 8.50 8.50 8.50 8.25 8.25 8.25
Rate of compensation increase 4.00 4.00 4.00 N/A 4.00 4.00
In order to project the long-term target investment return for the total
portfolio, estimates are prepared for the total return of each major asset
class over the subsequent 10-year period, or longer. Those estimates are
based on a combination of factors including the current market interest
rates and valuation levels, consensus earnings expectations, historical