Verizon Wireless 2009 Annual Report Download - page 47
Download and view the complete annual report
Please find page 47 of the 2009 Verizon Wireless annual report below. You can navigate through the pages in the report by either clicking on the pages listed below, or by using the keyword search tool below to find specific information within the annual report.-
 1
1 -
2
-
3
-
4
-
5
-
6
-
7
-
8
-
9
-
10
-
11
-
12
-
13
-
14
-
15
-
16
-
17
-
18
-
19
-
20
-
21
-
22
-
23
-
24
-
25
-
26
-
27
-
28
-
29
-
30
-
31
-
32
-
33
-
34
-
35
-
36
-
 37
37 -
 38
38 -
 39
39 -
 40
40 -
 41
41 -
 42
42 -
 43
43 -
 44
44 -
 45
45 -
 46
46 -
 47
47 -
 48
48 -
 49
49 -
 50
50 -
 51
51 -
 52
52 -
 53
53 -
 54
54 -
 55
55 -
 56
56 -
 57
57 -
58
-
59
-
60
-
61
-
62
-
63
-
64
-
65
-
66
-
67
-
68
-
69
-
70
-
71
-
72
-
73
-
74
-
75
-
76
-
77
-
78
-
79
-
80
 |
 |

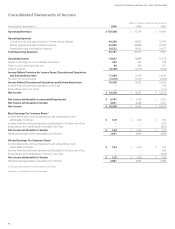
Consolidated Statements of Changes in Equity
45
(dollars in millions, except per share amounts, and shares in thousands)
Years Ended December 31, 2009 2008 2007
Shares Amount Shares Amount Shares Amount
Common Stock
Balance at beginning of year 2,967,610 $ 297 2,967,610 $ 297 2,967,652 $ 297
Other – – – – (42) –
Balance at end of year 2,967,610 297 2,967,610 297 2,967,610 297
Contributed Capital
Balance at beginning of year 40,291 40,316 40,124
Shares issued-employee and shareowner plans –– 58
Other (183) (25) 134
Balance at end of year 40,108 40,291 40,316
Reinvested Earnings
Balance at beginning of year 19,250 17,884 17,324
Adoption of tax accounting standards –– (134)
Adjusted balance at beginning of year 19,250 17,884 17,190
Net income attributable to Verizon 3,651 6,428 5,521
Dividends declared ($1.87, $1.78 and $1.67 per share) (5,309) (5,062) (4,830)
Other –– 3
Balance at end of year 17,592 19,250 17,884
Accumulated Other Comprehensive Loss
Balance at beginning of year attributable to Verizon (13,372) (4,484) (7,503)
Spin-off of local exchange businesses in Maine, New Hampshire
and Vermont (Note 3) – 44 –
Adjusted balance at beginning of year (13,372) (4,440) (7,503)
Foreign currency translation adjustments 78 (231) 838
Unrealized gains (losses) on marketable securities 87 (97) (4)
Unrealized gains (losses) on cash flow hedges 87 (40) 1
Defined benefit pension and postretirement plans 1,641 (8,564) 1,943
Other –– 241
Other comprehensive income (loss) 1,893 (8,932) 3,019
Balance at end of year attributable to Verizon (11,479) (13,372) (4,484)
Treasury Stock
Balance at beginning of year (127,090) (4,839) (90,786) (3,489) (56,147) (1,871)
Shares purchased – – (36,779) (1,368) (68,063) (2,843)
Other (Note 10) (5,000) (166) ––––
Shares distributed
Employee plans 142 5 468 18 33,411 1,224
Shareowner plans 6 – 7 – 13 1
Balance at end of year (131,942) (5,000) (127,090) (4,839) (90,786) (3,489)
Deferred Compensation–ESOPs and Other
Balance at beginning of year 79 79 191
Amortization 9 – (112)
Balance at end of year 88 79 79
Noncontrolling Interest
Balance at beginning of year 37,199 32,266 28,310
Net income attributable to noncontrolling interest 6,707 6,155 5,053
Other comprehensive income (loss) 103 (30) 5
Total comprehensive income 6,810 6,125 5,058
Distributions and other (1,248) (1,192) (1,102)
Balance at end of year 42,761 37,199 32,266
Total Equity $ 84,367 $ 78,905 $ 82,869
Comprehensive Income
Net income $ 10,358 $ 12,583 $ 10,574
Other comprehensive income (loss) 1,996 (8,962) 3,024
Total Comprehensive Income $ 12,354 $ 3,621 $ 13,598
Comprehensive income attributable to noncontrolling interest $ 6,810 $ 6,125 $ 5,058
Comprehensive income (loss) attributable to Verizon 5,544 (2,504) 8,540
Total Comprehensive Income $ 12,354 $ 3,621 $ 13,598
See Notes to Consolidated Financial Statements
VERIZON COMMUNICATIONS INC. AND SUBSIDIARIES