Verizon Wireless 2009 Annual Report Download - page 22
Download and view the complete annual report
Please find page 22 of the 2009 Verizon Wireless annual report below. You can navigate through the pages in the report by either clicking on the pages listed below, or by using the keyword search tool below to find specific information within the annual report.-
 1
1 -
2
-
3
-
4
-
5
-
6
-
7
-
8
-
9
-
10
-
11
-
 12
12 -
 13
13 -
 14
14 -
 15
15 -
 16
16 -
 17
17 -
 18
18 -
 19
19 -
 20
20 -
 21
21 -
 22
22 -
 23
23 -
 24
24 -
 25
25 -
 26
26 -
 27
27 -
 28
28 -
 29
29 -
 30
30 -
 31
31 -
 32
32 -
33
-
34
-
35
-
36
-
37
-
38
-
39
-
40
-
41
-
42
-
43
-
44
-
45
-
46
-
47
-
48
-
49
-
50
-
51
-
52
-
53
-
54
-
55
-
56
-
57
-
58
-
59
-
60
-
61
-
62
-
63
-
64
-
65
-
66
-
67
-
68
-
69
-
70
-
71
-
72
-
73
-
74
-
75
-
76
-
77
-
78
-
79
-
80
 |
 |

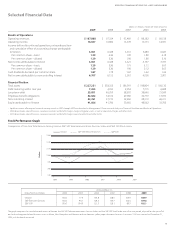
20
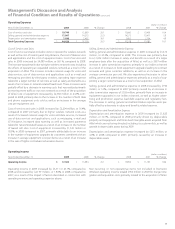
Interest Expense (dollars in millions)
Years Ended December 31, 2009 2008 % Change 2008 2007 % Change
Total interest costs on debt balances $ 4,029 $ 2,566 57.0 $ 2,566 $ 2,258 13.6
Less capitalized interest costs 927 747 24.1 747 429 74.1
Total $ 3,102 $ 1,819 70.5 $ 1,819 $ 1,829 (0.5)
Average debt outstanding $ 64,039 $ 41,064 $ 41,064 $ 32,964
Effective interest rate 6.29% 6.25% 6.25% 6.85%
Total interest costs on debt balances in 2009 increased by $1,463 million
compared to 2008, primarily due to the $23 billion increase in the average
debt levels. The increase in average debt outstanding compared to 2008
was primarily driven by borrowings to finance the acquisition of Alltel.
The increase in capitalized interest costs during 2009 primarily related
to capitalization of interest on wireless licenses under development for
commercial service primarily as a result of the spectrum acquired in the
700 MHz auction (see “Consolidated Financial Condition”).
Management’s Discussion and Analysis
of Financial Condition and Results of Operations continued
Total interest costs on debt balances in 2008 increased by $308 million,
compared to 2007, due to an increase in the average debt level, partially
offset by lower interest rates compared to 2007. Interest expense in 2008
decreased $10 million compared to 2007 primarily due to higher capital-
ized interest costs. The increase in capitalized interest costs was related to
the development of wireless licenses. The increase in average debt out-
standing was primarily driven by the issuance of $8,000 million of fixed
rate notes with varying maturities, in the first half of 2008, and to a lesser
extent, the Verizon Wireless borrowings during the second half of 2008
(see “Consolidated Financial Condition”).
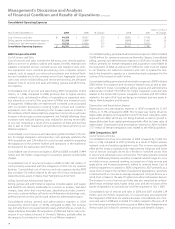
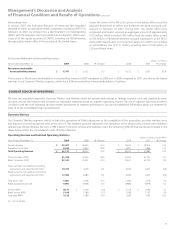
Provision for Income Taxes (dollars in millions)
Years Ended December 31, 2009 2008 % Change 2008 2007 % Change
Provision for income taxes $ 1,210 $ 3,331 (63.7) $ 3,331 $ 3,982 (16.3)
Effective income tax rate 10.5% 20.9% 20.9% 27.4%
The effective income tax rate is calculated by dividing the provision
for income taxes by income before the provision for income taxes. Our
effective tax rate is significantly lower than the statutory federal income
tax rate for all years presented due to the inclusion of income attribut-
able to Vodafone Group Plc.’s (Vodafone) noncontrolling interest in the
Verizon Wireless partnership within our Income before the provision for
income taxes.
The effective income tax rate in 2009 decreased to 10.5% from 20.9% in
2008. The decrease was primarily driven by higher earnings attributable
to the noncontrolling interest.
The state and local income tax rate in 2009 was lower than 2008 due
to reductions in unrecognized tax benefits after statutes of limitations in
multiple jurisdictions lapsed and the impact of earnings attributable to
the noncontrolling interest.
The effective income tax rate in 2008 decreased to 20.9% from 27.4% in
2007. The decrease was primarily due to recording $610 million of for-
eign and domestic taxes and expenses in 2007 relating to our share of
Vodafone Omnitel’s distributable earnings. This expense, which increased
the effective tax rate by 3.9 percentage points in 2007 compared to 2008,
was primarily comprised of $300 million of Italian withholding taxes
and $260 million of U.S. federal income taxes. Verizon received net dis-
tributions from Vodafone Omnitel in April 2008 and December 2007 of
approximately $670 million and $2,100 million, respectively.
The state and local income tax rate in 2008 was higher than 2007 primarily
due to an increase in earnings at Verizon Wireless apportioned to states
with higher state income tax rates than the remainder of the Company’s
operations. This increase was partially offset by lower expenses recorded
for unrecognized tax benefits in 2008 compared to 2007.
A reconciliation of the statutory federal income tax rate to the effective
income tax rate for each period is included in Note 13 to the consoli-
dated financial statements.
The Company projects its 2010 effective tax rate to be in the range of 18%
to 20% excluding the impact of integration and similar costs incurred in
connection with the Alltel acquisition, divestiture of Alltel overlapping
properties, and divestiture of access lines. As a global commercial enter-
prise, it is difficult to forecast the Company’s full-year effective tax rate
with any further precision due to the numerous factors that could occur
and impact the rate. Examples of these factors include possible changes
in federal, state and foreign income tax laws or rates, developments with
respect to open tax years and income tax audits requiring adjustments to
unrecognized tax benefits, acquisitions and dispositions, and changes in
operating results that would require increases or decreases to valuation
allowances. For 2010, excluding earnings attributable to the noncontrol-
ling interest in Verizon Wireless would result in a projected effective tax
rate of 33% to 35% attributable to Verizon.
Discontinued Operations
On March 30, 2007, after receiving Federal Communications Commission
(FCC) approval, we completed the sale of our 52% interest in TELPRI and
received gross proceeds of approximately $980 million. The sale resulted
in a pretax gain of $120 million ($70 million after-tax, or $.02 per diluted
share). Additionally, $100 million of the proceeds were contributed to the
Verizon Foundation.
We have classified the financial information of TELPRI as discontinued
operations in the consolidated financial statements for all periods pre-
sented through the date of the divestiture.