Verizon Wireless 2009 Annual Report Download - page 23
Download and view the complete annual report
Please find page 23 of the 2009 Verizon Wireless annual report below. You can navigate through the pages in the report by either clicking on the pages listed below, or by using the keyword search tool below to find specific information within the annual report.-
 1
1 -
2
-
3
-
4
-
5
-
6
-
7
-
8
-
9
-
10
-
11
-
12
-
 13
13 -
 14
14 -
 15
15 -
 16
16 -
 17
17 -
 18
18 -
 19
19 -
 20
20 -
 21
21 -
 22
22 -
 23
23 -
 24
24 -
 25
25 -
 26
26 -
 27
27 -
 28
28 -
 29
29 -
 30
30 -
 31
31 -
 32
32 -
 33
33 -
34
-
35
-
36
-
37
-
38
-
39
-
40
-
41
-
42
-
43
-
44
-
45
-
46
-
47
-
48
-
49
-
50
-
51
-
52
-
53
-
54
-
55
-
56
-
57
-
58
-
59
-
60
-
61
-
62
-
63
-
64
-
65
-
66
-
67
-
68
-
69
-
70
-
71
-
72
-
73
-
74
-
75
-
76
-
77
-
78
-
79
-
80
 |
 |

21
Extraordinary Item
In January 2007, the Bolivarian Republic of Venezuela (the Republic)
declared its intent to nationalize certain companies, including CANTV. On
February 12, 2007, we entered into a Memorandum of Understanding
(MOU) with the Republic, which provided that the Republic offer to pur-
chase all of the equity securities of CANTV, including our 28.5% interest,
through public tender offers in Venezuela and the United States.
Management’s Discussion and Analysis
of Financial Condition and Results of Operations continued
Under the terms of the MOU, the prices in the tender offers would be
adjusted downward to reflect any dividends declared and paid sub-
sequent to February 12, 2007. During 2007, the tender offers were
completed and Verizon received an aggregate amount of approximately
$572 million, which included $476 million from the tender offers as well
as $96 million of dividends declared and paid subsequent to the MOU.
During 2007, based upon our investment balance in CANTV, we recorded
an extraordinary loss of $131 million, including taxes of $38 million, or
$.05 per diluted share.
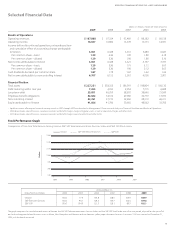
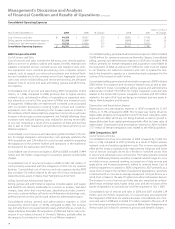
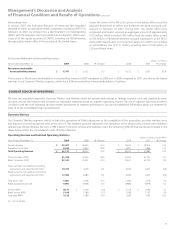
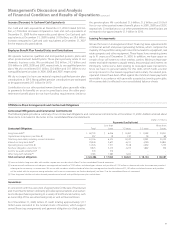
Net Income Attributable to Noncontrolling Interest (dollars in millions)
Years Ended December 31, 2009 2008 % Change 2008 2007 % Change
Net income attributable
to noncontrolling interest $ 6,707 $ 6,155 9.0 $ 6,155 $ 5,053 21.8
The increase in Net income attributable to noncontrolling interest in 2009 compared to 2008, and in 2008 compared to 2007, was due to the higher
earnings in our Domestic Wireless segment, which has a 45% noncontrolling interest attributable to Vodafone.
SEGMENT RESULTS OF OPERATIONS
We have two reportable segments, Domestic Wireless and Wireline, which we operate and manage as strategic business units and organize by prod-
ucts and services. We measure and evaluate our reportable segments based on segment operating income. The use of segment operating income is
consistent with the chief operating decision maker’s assessment of segment performance. You can find additional information about our segments in
Note 14 to the consolidated financial statements.
Domestic Wireless
Our Domestic Wireless segment, which includes the operations of Alltel subsequent to the completion of the acquisition, provides wireless voice
and data services and equipment sales across the U.S. This segment primarily represents the operations of the Verizon joint venture with Vodafone,
operating as Verizon Wireless. We own a 55% interest in the joint venture and Vodafone owns the remaining 45%. All financial results included in the
tables below reflect the consolidated results of Verizon Wireless.
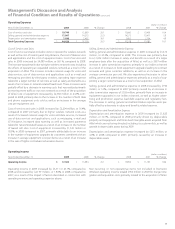
Operating Revenue and Selected Operating Statistics (dollars in millions, except ARPU)
Years Ended December 31, 2009 2008 % Change 2008 2007 % Change
Service revenue $ 53,497 $ 42,635 25.5 $ 42,635 $ 38,016 12.2
Equipment and other 8,634 6,697 28.9 6,697 5,866 14.2
Total Operating Revenue $ 62,131 $ 49,332 25.9 $ 49,332 $ 43,882 12.4
Total customers ('000) 91,249 72,056 26.6 72,056 65,707 9.7
Retail customers ('000) 87,523 70,021 25.0 70,021 63,735 9.9
Total customer net additions (including
acquisitions and adjustments) ('000) 19,193 6,349 nm 6,349 6,655 (4.6)
Retail customer net additions (including
acquisitions and adjustments) ('000) 17,502 6,286 nm 6,286 6,923 (9.2)
Total churn rate 1.44% 1.25% 15.2 1.25% 1.21% 3.3
Retail postpaid churn rate 1.09% 0.96% 13.5 0.96% 0.91% 5.5
Service ARPU $ 50.77 $ 51.59 (1.6) $ 51.59 $ 50.96 1.2
Retail service ARPU 51.00 51.88 (1.7) 51.88 51.57 0.6
Total data ARPU 15.20 12.89 17.9 12.89 9.90 30.2
nm - not meaningful