Verizon Wireless 2009 Annual Report Download - page 70
Download and view the complete annual report
Please find page 70 of the 2009 Verizon Wireless annual report below. You can navigate through the pages in the report by either clicking on the pages listed below, or by using the keyword search tool below to find specific information within the annual report.-
 1
1 -
2
-
3
-
4
-
5
-
6
-
7
-
8
-
9
-
10
-
11
-
12
-
13
-
14
-
15
-
16
-
17
-
18
-
19
-
20
-
21
-
22
-
23
-
24
-
25
-
26
-
27
-
28
-
29
-
30
-
31
-
32
-
33
-
34
-
35
-
36
-
37
-
38
-
39
-
40
-
41
-
42
-
43
-
44
-
45
-
46
-
47
-
48
-
49
-
50
-
51
-
52
-
53
-
54
-
55
-
56
-
57
-
58
-
59
-
 60
60 -
 61
61 -
 62
62 -
 63
63 -
 64
64 -
 65
65 -
 66
66 -
 67
67 -
 68
68 -
 69
69 -
 70
70 -
 71
71 -
 72
72 -
 73
73 -
 74
74 -
 75
75 -
 76
76 -
 77
77 -
 78
78 -
 79
79 -
 80
80
 |
 |

68
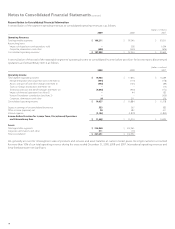
Notes to Consolidated Financial Statements continued
In 2008, we completed the spin-off of our local exchange and related busi-
ness assets in Maine, New Hampshire and Vermont. Accordingly, Wireline
results from divested operations, including the impact of the non stra-
tegic assets sold during the first quarter of 2007, have been reclassified to
Corporate and Other and reflect comparable operating results. In 2007,
we completed the sale of our 52% interest in TELPRI and our interest in
CANTV which were reported in our former International segment.
Our segments and their principal activities consist of the following:
Segment Description
Domestic Wireless Domestic Wireless’s products and services include
wireless voice and data services and equipment sales
across the U.S.
Wireline Wireline’s communications products and services include
voice, Internet access, broadband video and data, next
generation Internet protocol (IP) network services,
network access, long distance and other services. We
provide these products and services to consumers in the
U.S., as well as to carriers, businesses and government
customers both in the U.S. and in 150 other countries
around the world.
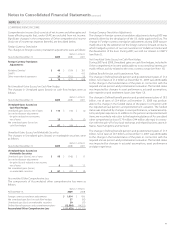
NOTE 14
SEGMENT INFORMATION
Reportable Segments
We have two reportable segments, which we operate and manage as
strategic business units and organize by products and services. We mea-
sure and evaluate our reportable segments based on segment operating
income, consistent with the chief operating decision maker’s assessment
of segment performance.
Beginning in 2009, we changed the manner in which the Wireline seg-
ment reports Operating revenues to align our financial presentation
to the continued evolution of the wireline business. Accordingly, there
are four revenue-producing lines of business within the Wireline seg-
ment: Mass Markets, Global Enterprise, Global Wholesale and Other.
Mass Markets includes consumer and small business revenues. Global
Enterprise includes retail revenue from enterprise customers, both
domestic and international. Global Wholesale includes wholesale reve-
nues, both domestic and international. Other primarily includes operator
services, payphone services and revenues from the former MCI mass
markets customer base.
Corporate, eliminations and other includes unallocated corporate
expenses, intersegment eliminations recorded in consolidation, the
results of other businesses, such as our investments in unconsolidated
businesses, lease financing, and other adjustments and gains and losses
that are not allocated in assessing segment performance due to their
non-recurring or non-operational nature. Although such transactions
are excluded from the business segment results, they are included in
reported consolidated earnings. Gains and losses that are not individu-
ally significant are included in all segment results, since these items are
included in the chief operating decision maker’s assessment of segment
performance.
The reconciliation of segment operating revenues and expenses to con-
solidated operating revenues and expenses below also include those
items of a non-recurring or non-operational nature. We exclude from
segment results the effects of certain items that management does not
consider in assessing segment performance, primarily because of their
non-recurring non-operational nature.
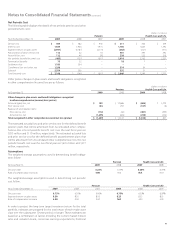
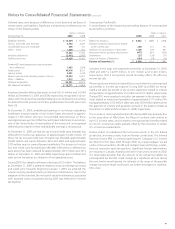
The following table provides operating financial information for our two reportable segments:
(dollars in millions)
2009 Domestic Wireless Wireline Total Segments
External Operating Revenues
Service revenue $ 53,426 $ – $ 53,426
Equipment and other 8,604 – 8,604
Mass Markets – 19,744 19,744
Global Enterprise – 14,988 14,988
Global Wholesale – 8,387 8,387
Other – 1,626 1,626
Intersegment revenues 101 1,335 1,436
Total operating revenues 62,131 46,080 108,211
Cost of services and sales 19,749 24,144 43,893
Selling, general and administrative expense 17,847 10,833 28,680
Depreciation and amortization expense 7,030 9,122 16,152
Total operating expenses 44,626 44,099 88,725
Operating income $ 17,505 $ 1,981 $ 19,486
Assets $ 135,162 $ 91,778 $ 226,940
Plant, property and equipment, net 30,849 59,373 90,222
Capital expenditures 7,152 8,892 16,044