Verizon Wireless 2009 Annual Report Download - page 26
Download and view the complete annual report
Please find page 26 of the 2009 Verizon Wireless annual report below. You can navigate through the pages in the report by either clicking on the pages listed below, or by using the keyword search tool below to find specific information within the annual report.-
 1
1 -
2
-
3
-
4
-
5
-
6
-
7
-
8
-
9
-
10
-
11
-
12
-
13
-
14
-
15
-
 16
16 -
 17
17 -
 18
18 -
 19
19 -
 20
20 -
 21
21 -
 22
22 -
 23
23 -
 24
24 -
 25
25 -
 26
26 -
 27
27 -
 28
28 -
 29
29 -
 30
30 -
 31
31 -
 32
32 -
 33
33 -
 34
34 -
 35
35 -
 36
36 -
37
-
38
-
39
-
40
-
41
-
42
-
43
-
44
-
45
-
46
-
47
-
48
-
49
-
50
-
51
-
52
-
53
-
54
-
55
-
56
-
57
-
58
-
59
-
60
-
61
-
62
-
63
-
64
-
65
-
66
-
67
-
68
-
69
-
70
-
71
-
72
-
73
-
74
-
75
-
76
-
77
-
78
-
79
-
80
 |
 |

24
Management’s Discussion and Analysis
of Financial Condition and Results of Operations continued
Wireline
The Wireline segment provides customers with communication products and services, including voice, broadband video and data, network access,
long distance, and other services, to residential and small business customers and carriers, as well as next-generation IP network services and com-
munications solutions to medium and large businesses and government customers globally.
The results of operations presented below exclude the local exchange and related business assets in Maine, New Hampshire and Vermont that were
spun-off on March 31, 2008.
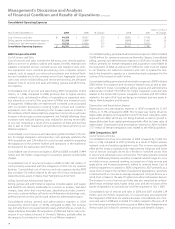
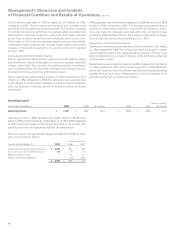
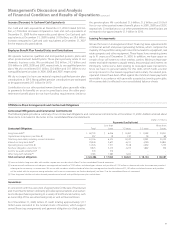
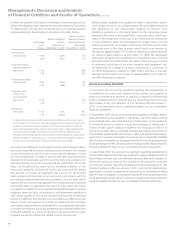
Operating Revenues and Selected Operating Statistics (dollars in millions)
Years Ended December 31, 2009 2008 % Change 2008 2007 % Change
Mass Markets $ 19,755 $19,799 (0.2) $19,799 $19,570 1.2
Global Enterprise 14,988 15,779 (5.0) 15,779 15,710 0.4
Global Wholesale 9,637 10,360 (7.0) 10,360 10,750 (3.6)
Other 1,700 2,276 (25.3) 2,276 3,099 (26.6)
Total Operating Revenues $ 46,080 $48,214 (4.4) $48,214 $49,129 (1.9)
Switched access lines in service ('000) 32,561 36,161 (10.0) 36,161 39,883 (9.3)
Broadband connections ('000) 9,220 8,673 6.3 8,673 8,013 8.2
FiOS Internet subscribers ('000) 3,433 2,481 38.4 2,481 1,525 62.7
FiOS TV subscribers ('000) 2,861 1,918 49.2 1,918 943 103.4
Mass Markets
Mass Markets revenue includes local exchange (basic service and end-
user access), long distance (including regional toll), broadband services
(including high-speed Internet and FiOS Internet) and FiOS TV services
for residential and small business subscribers.
Mass Markets revenue during 2009 decreased by $44 million, or 0.2%,
compared to 2008. The decrease was primarily driven by a decline in local
exchange revenues principally due to a 10.0% decline in switched access
lines as of December 31, 2009 compared to December 31, 2008, primarily
as a result of competition and technology substitution. The majority of
the decrease was sustained in the residential retail market, which experi-
enced an 11.0% access line loss primarily due to substituting traditional
landline services with wireless, VoIP, broadband and cable services. Also
contributing to the decrease was a decline of nearly 7.0% in small business
retail access lines, primarily reflecting economic conditions, competition
and a shift to both IP and high-speed circuits. Partially offsetting these
decreases was the expansion of FiOS services (Voice, Internet and TV).
As we continue to expand the number of premises eligible to order
FiOS services and extend our sales and marketing efforts to attract new
FiOS subscribers, we have continued to grow our subscriber base and
consistently improved penetration rates within our FiOS service areas.
Our bundled pricing strategy allows us to provide competitive offerings
to our customers and potential customers. Consequently, we added
547,000 net new broadband connections, including 952,000 net new
FiOS Internet subscribers in 2009. In addition, we added 943,000 net new
FiOS TV subscribers in 2009, for a total of 2,861,000 at December 31, 2009.
As of December 31, 2009, we achieved penetration rates of 28.1% and
24.5% for FiOS Internet and FiOS TV, respectively, compared to penetra-
tion rates of 24.9% and 20.8% for FiOS Internet and FiOS TV, respectively,
at December 31, 2008.
Our Mass Markets revenue in 2008 increased by $229 million, or 1.2%,
compared to 2007. This increase was primarily driven by continued
expansion of consumer and business FiOS services (Voice, Internet and
TV), which are typically sold in bundles, partially offset by lower demand
and usage of our basic local exchange and accompanying services,
attributable to consumer subscriber line losses driven by competition
and technology substitution, including wireless and VoIP.
We added 660,000 net new broadband connections, including 956,000
net new FiOS Internet connections, in 2008. We ended 2008 with
8,673,000 net broadband connections, including 2,481,000 net FiOS
Internet subscribers, representing an 8.2% increase in total broadband
connections compared to 8,013,000 connections at December 31, 2007.
In addition, we added approximately 975,000 net new FiOS TV sub-
scribers in 2008 and ended the year with a total of 1,918,000, an increase
of approximately 103.4%. As of December 31, 2008, for FiOS Internet and
FiOS TV, we achieved penetration rates of 24.9% and 20.8%, respectively,
across all markets where we have been selling these services.
Declines in switched access lines in service of 10.0% in 2009 and 9.3% in
2008 were mainly driven by the effects of competition and technology
substitution. Residential retail access lines declined as customers substi-
tuted wireless, VoIP, broadband and cable services for traditional voice
landline services. At the same time, small business retail access lines
declined primarily reflecting competition and a shift to high-speed
access lines.
Global Enterprise
Global Enterprise offers voice, data and Internet communications services
to medium and large business customers, multi-national corporations,
and state and federal government customers. In addition to traditional
voice and data services, Global Enterprise offers managed and advanced
products and solutions including IP services and value-added solutions
that make communications more secure, reliable and efficient. Global
Enterprise also provides managed network services for customers that
outsource all or portions of their communications and information pro-
cessing operations and data services such as private IP, private line, frame
relay and asynchronous transfer mode (ATM) services, both domestically
and internationally. In addition, Global Enterprise offers professional ser-
vices in more than 30 countries supporting a range of solutions including
network service, managing a move to IP-based unified communications
and providing application performance support.
Global Enterprise revenues during 2009 decreased by $791 million, or
5.0%, compared to 2008. The revenue decline was due to lower long
distance and traditional circuit based data revenues and lower customer
premises equipment revenue, combined with the negative effect of