Verizon Wireless 2009 Annual Report Download - page 66
Download and view the complete annual report
Please find page 66 of the 2009 Verizon Wireless annual report below. You can navigate through the pages in the report by either clicking on the pages listed below, or by using the keyword search tool below to find specific information within the annual report.-
 1
1 -
2
-
3
-
4
-
5
-
6
-
7
-
8
-
9
-
10
-
11
-
12
-
13
-
14
-
15
-
16
-
17
-
18
-
19
-
20
-
21
-
22
-
23
-
24
-
25
-
26
-
27
-
28
-
29
-
30
-
31
-
32
-
33
-
34
-
35
-
36
-
37
-
38
-
39
-
40
-
41
-
42
-
43
-
44
-
45
-
46
-
47
-
48
-
49
-
50
-
51
-
52
-
53
-
54
-
55
-
 56
56 -
 57
57 -
 58
58 -
 59
59 -
 60
60 -
 61
61 -
 62
62 -
 63
63 -
 64
64 -
 65
65 -
 66
66 -
 67
67 -
 68
68 -
 69
69 -
 70
70 -
 71
71 -
 72
72 -
 73
73 -
 74
74 -
 75
75 -
 76
76 -
77
-
78
-
79
-
80
 |
 |

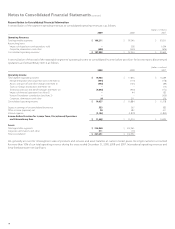
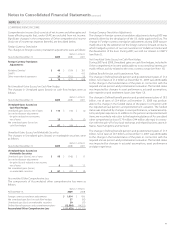
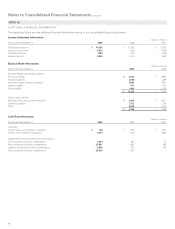
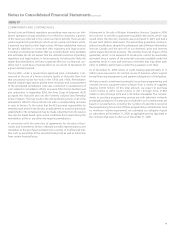
Notes to Consolidated Financial Statements continued
64
long-term risk premiums and value-added. To determine the aggregate
return for the pension trust, the projected return of each individual asset
class is then weighted according to the allocation to that investment area
in the trust’s long-term asset allocation policy.
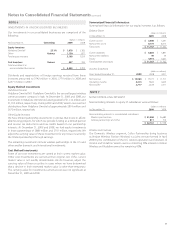
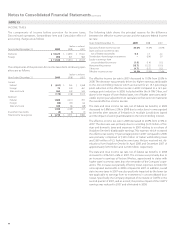
The assumed Health Care Cost Trend Rates follow:
Health Care and Life
At December 31, 2009 2008 2007
Healthcare cost trend rate assumed
for next year 8.00% 9.00% 10.00%
Rate to which cost trend rate
gradually declines 5.00 5.00 5.00
Year the rate reaches level it is assumed
to remain thereafter 2014 2014 2013
A one-percentage-point change in the assumed health care cost trend
rate would have the following effects:
(dollars in millions)
One-Percentage-Point Increase Decrease
Effect on 2009 service and interest cost $ 277 $ (216)
Effect on postretirement benefit obligation as of
December 31, 2009 3,053 (2,520)
Plan Assets
Our portfolio strategy emphasizes a long-term equity orientation, signifi-
cant global diversification, the use of both public and private investments
and financial and operational risk controls. Our diversification and risk
control processes serve to minimize the concentration of risk. Assets are
allocated according to long-term risk and return estimates. Both active
and passive management approaches are used depending on perceived
market efficiencies and various other factors.
While target allocation percentages will vary over time, the company’s
overall investment strategy is to achieve a mix of assets, which allows us
to meet projected benefits payments while taking into consideration risk
and return. The target allocations for plan assets are currently 60% equity,
25% fixed income, 9% private equity, 4% real estate and 2% cash invest-
ments. Our target policies are revisited every few years to ensure they are
in line with fund objectives. There are no significant concentrations of
risk, in terms of sector, industry, geography or company names.
Pension plan assets include Verizon common stock of $67 million and $87
million at December 31, 2009 and 2008, respectively. In our health care
and life plans, there was not a significant amount of Verizon common
stock held at the end of 2009 and 2008.
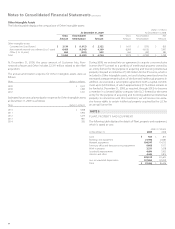
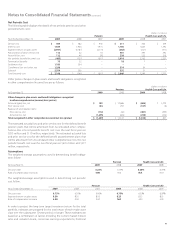
Pension Plans
The fair values for the pension plans by asset category at December 31,
2009 are as follows:
(dollars in millions)
Asset Category Total Level 1 Level 2 Level 3
Cash and cash equivalents $ 2,299 $ 2,299 $ – $ –
Equity securities 12,691 12,691 – –
Fixed income securities
U.S. Treasuries and agencies 1,095 428 667 –
Corporate bonds 2,531 158 2,236 137
International bonds 1,112 774 338 –
Other 646 – 646 –
Real estate 1,541 – – 1,541
Other
Private equity 5,362 – 26 5,336
Hedge funds 1,315 – 1,315 –
Total $ 28,592 $ 16,350 $ 5,228 $ 7,014
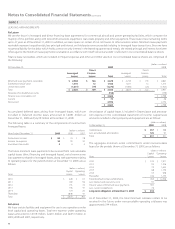
A reconciliation of the beginning and ending balance of pension plan
assets that are measured at fair value using significant unobservable
inputs as of December 31, 2009 is as follows:
(dollars in millions)
Corporate
Bonds
Real
Estate
Private
Equity Total
Balance at December 31, 2008 $ 23 $ 1,665 $ 5,101 $ 6,789
Actual gain (loss) on plan assets 26 (455) (5) (434)
Purchases and sales 84 331 263 678
Transfers in and/or out of Level 3 4 – (23) (19)
Balance at December 31, 2009 $ 137 $ 1,541 $ 5,336 $ 7,014
The fair values for the other postretirement benefit plans by asset cat-
egory at December 31, 2009 are as follows:
(dollars in millions)
Asset Category Total Level 1 Level 2 Level 3
Cash and cash equivalents $ 166 $ 27 $ 139 $ –
Equity securities 2,240 1,795 445 –
Fixed income securities
U.S. Treasuries and agencies 61 36 25 –
Corporate bonds 275 42 233 –
International bonds 81 13 68 –
Other 231 – 231 –
Other 37 – 37 –
Total $ 3,091 $ 1,913 $ 1,178 $ –
Plan assets are recognized and measured at fair value in accordance
with the accounting standards regarding fair value measurements. The
following are general descriptions of asset categories, as well as the valu-
ation methodologies and inputs used to determine the fair value of each
major category of plan assets.
Cash and cash equivalents include short-term investment funds, primarily
in diversified portfolios of investment grade money market instruments
and are valued using quoted market prices or other valuation methods,
and thus classified within Level 1 or Level 2 of the fair value hierarchy.
Equity securities are investments in common stock of domestic and
international corporations in a variety of industry sectors, and are valued
primarily using quoted market prices and generally classified within Level
1 in the fair value hierarchy.
Fixed income securities include U.S. Treasuries and agencies, debt obli-
gations of foreign governments and debt obligations in corporations of
domestic and foreign issuers. Fixed income also includes investments