American Airlines 2010 Annual Report Download - page 111
Download and view the complete annual report
Please find page 111 of the 2010 American Airlines annual report below. You can navigate through the pages in the report by either clicking on the pages listed below, or by using the keyword search tool below to find specific information within the annual report.-
 1
1 -
2
-
3
-
4
-
5
-
6
-
7
-
8
-
9
-
10
-
11
-
12
-
13
-
14
-
15
-
16
-
17
-
18
-
19
-
20
-
21
-
22
-
23
-
24
-
25
-
26
-
27
-
28
-
29
-
30
-
31
-
32
-
33
-
34
-
35
-
36
-
37
-
38
-
39
-
40
-
41
-
42
-
43
-
44
-
45
-
46
-
47
-
48
-
49
-
50
-
51
-
52
-
53
-
54
-
55
-
56
-
57
-
58
-
59
-
60
-
61
-
62
-
63
-
64
-
65
-
66
-
67
-
68
-
69
-
70
-
71
-
72
-
73
-
74
-
75
-
76
-
77
-
78
-
79
-
80
-
81
-
82
-
83
-
84
-
85
-
86
-
87
-
88
-
89
-
90
-
91
-
92
-
93
-
94
-
95
-
96
-
97
-
98
-
99
-
100
-
 101
101 -
 102
102 -
 103
103 -
 104
104 -
 105
105 -
 106
106 -
 107
107 -
 108
108 -
 109
109 -
 110
110 -
 111
111 -
 112
112 -
 113
113 -
 114
114 -
 115
115 -
 116
116 -
 117
117 -
 118
118
 |
 |

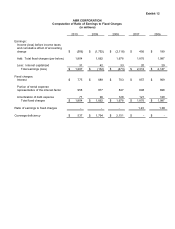
Exhibit 12
AMR CORPORATION
Computation of Ratio of Earnings to Fixed Charges
(in millions)
2010
2009
2008
2007
2006
Earnings:
Income (loss) before income taxes
and cumulative effect of accounting
change
$ (506)
$ (1,752)
$ (2,118)
$ 456
$ 189
Add: Total fixed charges (per below)
1,804
1,662
1,678
1,876
1,987
Less: Interest capitalized
31
42
33
20
29
Total earnings (loss)
$ 1,267
$ (132)
$ (473)
$ 2,312
$ 2,147
Fixed charges:
Interest
$ 775
$ 689
$ 703
$ 857
$ 969
Portion of rental expense
representative of the interest factor
958
877
847
898
898
Amortization of debt expense
71
96
128
121
120
Total fixed charges
$ 1,804
$ 1,662
$ 1,678
$ 1,876
$ 1,987
Ratio of earnings to fixed charges
-
-
-
1.23
1.08
Coverage deficiency
$ 537
$ 1,794
$ 2,151
$ -
$ -