American Airlines 2010 Annual Report Download - page 60
Download and view the complete annual report
Please find page 60 of the 2010 American Airlines annual report below. You can navigate through the pages in the report by either clicking on the pages listed below, or by using the keyword search tool below to find specific information within the annual report.-
 1
1 -
2
-
3
-
4
-
5
-
6
-
7
-
8
-
9
-
10
-
11
-
12
-
13
-
14
-
15
-
16
-
17
-
18
-
19
-
20
-
21
-
22
-
23
-
24
-
25
-
26
-
27
-
28
-
29
-
30
-
31
-
32
-
33
-
34
-
35
-
36
-
37
-
38
-
39
-
40
-
41
-
42
-
43
-
44
-
45
-
46
-
47
-
48
-
49
-
 50
50 -
 51
51 -
 52
52 -
 53
53 -
 54
54 -
 55
55 -
 56
56 -
 57
57 -
 58
58 -
 59
59 -
 60
60 -
 61
61 -
 62
62 -
 63
63 -
 64
64 -
 65
65 -
 66
66 -
 67
67 -
 68
68 -
 69
69 -
 70
70 -
71
-
72
-
73
-
74
-
75
-
76
-
77
-
78
-
79
-
80
-
81
-
82
-
83
-
84
-
85
-
86
-
87
-
88
-
89
-
90
-
91
-
92
-
93
-
94
-
95
-
96
-
97
-
98
-
99
-
100
-
101
-
102
-
103
-
104
-
105
-
106
-
107
-
108
-
109
-
110
-
111
-
112
-
113
-
114
-
115
-
116
-
117
-
118
 |
 |

57
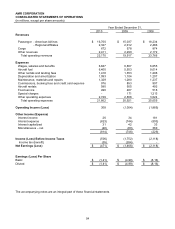
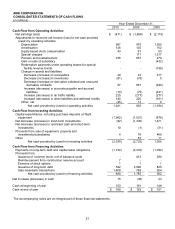
AMR CORPORATION
CONSOLIDATED STATEMENTS OF CASH FLOWS
(in millions)
Year Ended December 31,
2010
2009
2008
Cash Flow from Operating Activities:
Net earnings (loss)
$ (471)
$ (1,468)
$ (2,118)
Adjustments to reconcile net income (loss) to net cash provided
(used) by operating activities:
Depreciation
967
979
1,055
Amortization
126
125
152
Equity based stock compensation
43
61
53
Special charges
-
171
1,317
Pension and postretirement
236
657
279
Gain on sale of subsidiary
-
-
(432)
Redemption payments under operating leases for special
facility revenue bonds
-
-
(188)
Change in assets and liabilities:
Decrease (increase) in receivables
29
43
217
Decrease (increase) in inventories
(81)
(79)
5
Decrease (increase) in derivative collateral and unwound
derivative contracts
87
561
(940)
Increase (decrease) in accounts payable and accrued
liabilities
(19)
(75)
(421)
Increase (decrease) in air traffic liability
225
(277)
(277)
Increase (decrease) in other liabilities and deferred credits
144
220
(101)
Other, net
(45)
12
5
Net cash provided by (used in) operating activities
1,241
930
(1,394)
Cash Flow from Investing Activities:
Capital expenditures, including purchase deposits on flight
equipment
(1,962)
(1,521)
(876)
Net decrease (increase) in short-term investments
(82)
(1,330)
1,471
Net decrease (increase) in restricted cash and short-term
investments
10
(1)
(31)
Proceeds from sale of equipment, property and
investments/subsidiaries
4
76
480
Other
-
53
11
Net cash provided by (used in) investing activities
(2,030)
(2,723)
1,055
Cash Flow from Financing Activities:
Payments on long-term debt and capital lease obligations
(1,154)
(2,416)
(1,092)
Proceeds from:
Issuance of common stock, net of issuance costs
-
412
294
Reimbursement from construction reserve account
7
-
-
Exercise of stock options
1
1
1
Issuance of long-term debt
542
2,990
825
Sale leaseback transactions
1,408
768
354
Net cash provided by (used in) financing activities
804
1,755
382
Net increase (decrease) in cash
15
(38)
43
Cash at beginning of year
153
191
148
Cash at end of year
$ 168
$ 153
$ 191
The accompanying notes are an integral part of these financial statements.