American Airlines 2010 Annual Report Download - page 35
Download and view the complete annual report
Please find page 35 of the 2010 American Airlines annual report below. You can navigate through the pages in the report by either clicking on the pages listed below, or by using the keyword search tool below to find specific information within the annual report.-
 1
1 -
2
-
3
-
4
-
5
-
6
-
7
-
8
-
9
-
10
-
11
-
12
-
13
-
14
-
15
-
16
-
17
-
18
-
19
-
20
-
21
-
22
-
23
-
24
-
 25
25 -
 26
26 -
 27
27 -
 28
28 -
 29
29 -
 30
30 -
 31
31 -
 32
32 -
 33
33 -
 34
34 -
 35
35 -
 36
36 -
 37
37 -
 38
38 -
 39
39 -
 40
40 -
 41
41 -
 42
42 -
 43
43 -
 44
44 -
 45
45 -
46
-
47
-
48
-
49
-
50
-
51
-
52
-
53
-
54
-
55
-
56
-
57
-
58
-
59
-
60
-
61
-
62
-
63
-
64
-
65
-
66
-
67
-
68
-
69
-
70
-
71
-
72
-
73
-
74
-
75
-
76
-
77
-
78
-
79
-
80
-
81
-
82
-
83
-
84
-
85
-
86
-
87
-
88
-
89
-
90
-
91
-
92
-
93
-
94
-
95
-
96
-
97
-
98
-
99
-
100
-
101
-
102
-
103
-
104
-
105
-
106
-
107
-
108
-
109
-
110
-
111
-
112
-
113
-
114
-
115
-
116
-
117
-
118
 |
 |

32
While we believe that some of the bookings through Orbitz, Travelport, Expedia and Sabre have transitioned or
will transition to other distribution channels, such as other travel agencies, metasearch sites and American’s
AA.com web site, it is not possible at this time to estimate what the ultimate impact would be to our business if we
are unsuccessful in resolving one or more of these matters. If as a result of these matters it becomes more
difficult for our customers to find and book flights on American, we could be put at a competitive disadvantage
against our competitors and this may result in lower bookings. If we are unable to sell American inventory
through any or all of these channels, our level of bookings, business and results of operations could be materially
adversely affected. We also believe the actions taken by Travelport and Sabre described above are not permitted
by the applicable contracts. We intend to vigorously pursue our claims and defenses in the lawsuits described
above, but there can be no assurance of the outcome of any such lawsuit.
Financial Highlights
The Company recorded a net loss of $471 million in 2010 compared to a net loss of $1.5 billion in 2009. The
Company’s smaller net loss in 2010 reflects an improvement in a weak global economy; which led to higher
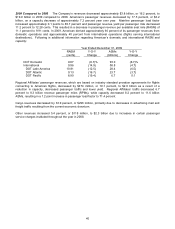
passenger revenues, partially offset by higher fuel prices. Mainline passenger revenue increased by $1.7 billion
to $16.8 billion for the year ended December 31, 2010 compared to 2009. Mainline passenger unit revenues
increased 10.4 percent in 2010 due to an 8.7 percent increase in passenger yield compared to 2009 and a load
factor increase of approximately 1.2 points. Passenger yield remains below the Company’s peak yield set in the
year 2000, despite cumulative inflation of approximately 27 percent over the same time frame. The Company
believes this is the result of a fragmented industry with numerous competitors and excess capacity, increased low
cost carrier competition, increased price competition due to the internet, and other factors. Since deregulation in
1978, the Company’s passenger yield has increased 78 percent, while the Consumer Price Index (CPI), as
measured by the U.S. Department of Labor Bureau of Labor Statistics, has grown by over 225 percent. The
Company believes increases in passenger yield will continue to significantly lag CPI indefinitely.
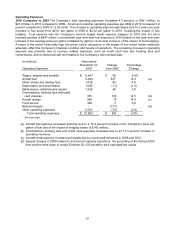
The increase in total passenger revenue was partially offset by significantly higher year-over-year fuel prices.
Fuel expense, taking into account the impact of fuel hedging, increased by $847 million to $6.4 billion for the year
ended December 31, 2010 compared to 2009. Hedging losses accounted for approximately $142 million of the
overall increase in fuel expense. The Company paid an average of $2.32 per gallon in 2010 compared to an
average of $2.01 per gallon in 2009, including effects of hedging. Although fuel prices have abated considerably
from the record high prices recorded in July 2008, they have increased since the first quarter of 2009, particularly
recently, and remain high and extremely volatile by historical standards. In addition, the Company’s unit costs,
excluding fuel and special charges, were greater for the year ended December 31, 2010 than for the same period
in 2009. Factors driving the increase include revenue related costs, such as credit card fees and booking fees
and commissions, and higher aircraft rent related to the Company’s fleet renewal plan. The Company remains
focused on cost reductions, but expects such factors to result in continuing cost pressures in 2011.
In addition, the Company’s 2010 results were negatively impacted by a net amount of $81 million in special items
related to the Venezuelan currency remeasurement in January 2010 and a non-cash impairment charge to write
down certain routes and slot authorities in Latin America as a result of open skies agreements. Comparatively,
the Company’s 2009 operating results were negatively impacted by a net amount of $107 million in special items,
restructuring charges and a non-cash tax item, including $184 million from the impairment of certain route and slot
authorities, primarily in Latin America, and losses on certain sale leaseback transactions. Restructuring charges
for 2009 were $171 million and related to announced capacity reductions, including the grounding of the Airbus
A300 fleet and the impairment of certain Embraer RJ-135 aircraft. Also included in 2009 results is a $248 million
non-cash tax benefit resulting from the allocation of the tax expense to other comprehensive income items
recognized during 2009. The 2009 restructuring charges, the 2009 non-cash tax item and the 2010 and 2009
route impairments are described in Notes 2, 8 and 11, respectively, to the consolidated financial statements.
The Company’s ability to become profitable and its ability to continue to fund its obligations on an ongoing basis
will depend on a number of factors, many of which are largely beyond the Company’s control. Certain risk factors
that affect the Company’s business and financial results are discussed in the Risk Factors listed in Item 1A.