American Airlines 2010 Annual Report Download - page 29
Download and view the complete annual report
Please find page 29 of the 2010 American Airlines annual report below. You can navigate through the pages in the report by either clicking on the pages listed below, or by using the keyword search tool below to find specific information within the annual report.-
 1
1 -
2
-
3
-
4
-
5
-
6
-
7
-
8
-
9
-
10
-
11
-
12
-
13
-
14
-
15
-
16
-
17
-
18
-
 19
19 -
 20
20 -
 21
21 -
 22
22 -
 23
23 -
 24
24 -
 25
25 -
 26
26 -
 27
27 -
 28
28 -
 29
29 -
 30
30 -
 31
31 -
 32
32 -
 33
33 -
 34
34 -
 35
35 -
 36
36 -
 37
37 -
 38
38 -
 39
39 -
40
-
41
-
42
-
43
-
44
-
45
-
46
-
47
-
48
-
49
-
50
-
51
-
52
-
53
-
54
-
55
-
56
-
57
-
58
-
59
-
60
-
61
-
62
-
63
-
64
-
65
-
66
-
67
-
68
-
69
-
70
-
71
-
72
-
73
-
74
-
75
-
76
-
77
-
78
-
79
-
80
-
81
-
82
-
83
-
84
-
85
-
86
-
87
-
88
-
89
-
90
-
91
-
92
-
93
-
94
-
95
-
96
-
97
-
98
-
99
-
100
-
101
-
102
-
103
-
104
-
105
-
106
-
107
-
108
-
109
-
110
-
111
-
112
-
113
-
114
-
115
-
116
-
117
-
118
 |
 |

26
PART II
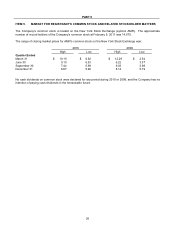
ITEM 5. MARKET FOR REGISTRANT'S COMMON STOCK AND RELATED STOCKHOLDER MATTERS
The Company's common stock is traded on the New York Stock Exchange (symbol AMR). The approximate
number of record holders of the Company's common stock at February 9, 2011 was 14,675.
The range of closing market prices for AMR's common stock on the New York Stock Exchange was:
2010
2009
High
Low
High
Low
Quarter Ended
March 31
$ 10.16
$ 6.92
$ 12.29
$ 2.54
June 30
9.10
6.53
6.22
3.37
September 30
7.44
5.99
9.03
3.98
December 31
8.87
5.96
8.14
5.19
No cash dividends on common stock were declared for any period during 2010 or 2009, and the Company has no
intention of paying cash dividends in the foreseeable future.