American Airlines 2010 Annual Report Download - page 86
Download and view the complete annual report
Please find page 86 of the 2010 American Airlines annual report below. You can navigate through the pages in the report by either clicking on the pages listed below, or by using the keyword search tool below to find specific information within the annual report.-
 1
1 -
2
-
3
-
4
-
5
-
6
-
7
-
8
-
9
-
10
-
11
-
12
-
13
-
14
-
15
-
16
-
17
-
18
-
19
-
20
-
21
-
22
-
23
-
24
-
25
-
26
-
27
-
28
-
29
-
30
-
31
-
32
-
33
-
34
-
35
-
36
-
37
-
38
-
39
-
40
-
41
-
42
-
43
-
44
-
45
-
46
-
47
-
48
-
49
-
50
-
51
-
52
-
53
-
54
-
55
-
56
-
57
-
58
-
59
-
60
-
61
-
62
-
63
-
64
-
65
-
66
-
67
-
68
-
69
-
70
-
71
-
72
-
73
-
74
-
75
-
 76
76 -
 77
77 -
 78
78 -
 79
79 -
 80
80 -
 81
81 -
 82
82 -
 83
83 -
 84
84 -
 85
85 -
 86
86 -
 87
87 -
 88
88 -
 89
89 -
 90
90 -
 91
91 -
 92
92 -
 93
93 -
 94
94 -
 95
95 -
 96
96 -
97
-
98
-
99
-
100
-
101
-
102
-
103
-
104
-
105
-
106
-
107
-
108
-
109
-
110
-
111
-
112
-
113
-
114
-
115
-
116
-
117
-
118
 |
 |

83
10. Retirement Benefits (Continued)
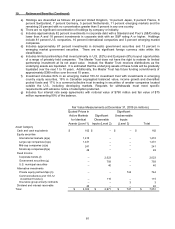
The fair values of the Company’s other postretirement benefit plan assets at December 31, 2010 by asset
category were as follows:
Fair Value Measurements at December 31, 2010 (in millions)
Quoted Prices in
Active Markets for
Identical Assets
(Level 1)
Significant
Observable
Inputs (Level 2)
Significant
Unobservable
Inputs
(Level 3)
Total
Asset Category
Money market fund
$ 4
$ –
$ –
$ 4
Unitized mutual funds
–
230
–
230
Total
$ 4
$ 230
$ –
$ 234
The fair values of the Company’s other postretirement benefit plan assets at December 31, 2009 by asset
category were as follows:
Fair Value Measurements at December 31, 2009 (in millions)
Quoted Prices in
Active Markets for
Identical Assets
(Level 1)
Significant
Observable
Inputs (Level 2)
Significant
Unobservable
Inputs
(Level 3)
Total
Asset Category
Money market fund
$ 4
$ –
$ –
$ 4
Unitized mutual funds
–
202
–
202
Total
$ 4
$ 202
$ –
$ 206
Investments in the unitized mutual funds are carried at the per share net asset value and include approximately
27 percent of investments in non-U.S. common stocks in 2010 and approximately 25 percent of investments in
non-U.S. common stocks in 2009. Net asset value is based on the fair market value of the funds’ underlying
assets and liabilities at the date of determination. Investments in the money market fund are valued at fair value
which represents the net assets value of the shares of such fund as of the close of business at the end of the
period.