American Airlines 2010 Annual Report Download - page 44
Download and view the complete annual report
Please find page 44 of the 2010 American Airlines annual report below. You can navigate through the pages in the report by either clicking on the pages listed below, or by using the keyword search tool below to find specific information within the annual report.-
 1
1 -
2
-
3
-
4
-
5
-
6
-
7
-
8
-
9
-
10
-
11
-
12
-
13
-
14
-
15
-
16
-
17
-
18
-
19
-
20
-
21
-
22
-
23
-
24
-
25
-
26
-
27
-
28
-
29
-
30
-
31
-
32
-
33
-
 34
34 -
 35
35 -
 36
36 -
 37
37 -
 38
38 -
 39
39 -
 40
40 -
 41
41 -
 42
42 -
 43
43 -
 44
44 -
 45
45 -
 46
46 -
 47
47 -
 48
48 -
 49
49 -
 50
50 -
 51
51 -
 52
52 -
 53
53 -
 54
54 -
55
-
56
-
57
-
58
-
59
-
60
-
61
-
62
-
63
-
64
-
65
-
66
-
67
-
68
-
69
-
70
-
71
-
72
-
73
-
74
-
75
-
76
-
77
-
78
-
79
-
80
-
81
-
82
-
83
-
84
-
85
-
86
-
87
-
88
-
89
-
90
-
91
-
92
-
93
-
94
-
95
-
96
-
97
-
98
-
99
-
100
-
101
-
102
-
103
-
104
-
105
-
106
-
107
-
108
-
109
-
110
-
111
-
112
-
113
-
114
-
115
-
116
-
117
-
118
 |
 |

41
Operating Expenses
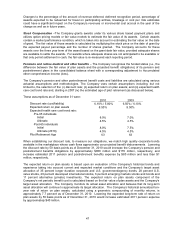
2010 Compared to 2009 The Company’s total operating expenses increased 4.5 percent, or $941 million, to
$21.9 billion in 2010 compared to 2009. American’s mainline operating expenses per ASM in 2010 increased 3.2
percent compared to 2009 to 12.62 cents. The increase in operating expense was largely due to a year-over-year
increase in fuel prices from $2.01 per gallon in 2009 to $2.32 per gallon in 2010, including the impact of fuel
hedging. Fuel expense was the Company’s second largest single expense category in 2010 and the price
increase resulted in $847 million in incremental year-over-year fuel expense in 2010 (based on the year-over-year
increase in the average price per gallon multiplied by gallons consumed, inclusive of the impact of fuel hedging).
A return to the recent historically high fuel prices and/or disruptions in the supply of fuel would further materially
adversely affect the Company’s financial condition and results of operations. The remaining increase in operating
expense was primarily due to revenue related expenses, such as credit card fees and booking fees and
commissions, and increased aircraft rent related to the Company’s fleet renewal plan.
(in millions)
Operating Expenses
Year ended
December 31,
2010
Change
from 2009
Percentage
Change
Wages, salaries and benefits
$ 6,847
$ 40
0.6%
Aircraft fuel
6,400
847
15.3
(a)
Other rentals and landing fees
1,418
65
4.8
Depreciation and amortization
1,093
(11)
(1.0)
Maintenance, materials and repairs
1,329
49
3.8
Commissions, booking fees and credit
card expense
976
123
14.5
(b)
Aircraft rentals
580
75
14.9
(c)
Food service
490
3
0.6
Special charges
-
(171)
*
(d)
Other operating expenses
2,729
(79)
(2.8)
Total operating expenses
$ 21,862
$ 941
4.5%
* Not meaningful
(a) Aircraft fuel expense increased primarily due to a 15.2 percent increase in the Company’s price per
gallon of fuel (net of the impact of hedging losses of $142 million).
(b) Commissions, booking fees and credit card expenses increased due to an 11.3 percent increase in
operating revenues.
(c) Aircraft rental expense increased principally due to new aircraft deliveries in 2009 and 2010.
(d) Special charges in 2009 related to announced capacity reductions, the grounding of the Airbus A300
fleet and the write down of certain Embraer RJ-135 aircraft to their estimated fair values.
.