American Airlines 2010 Annual Report Download - page 61
Download and view the complete annual report
Please find page 61 of the 2010 American Airlines annual report below. You can navigate through the pages in the report by either clicking on the pages listed below, or by using the keyword search tool below to find specific information within the annual report.-
 1
1 -
2
-
3
-
4
-
5
-
6
-
7
-
8
-
9
-
10
-
11
-
12
-
13
-
14
-
15
-
16
-
17
-
18
-
19
-
20
-
21
-
22
-
23
-
24
-
25
-
26
-
27
-
28
-
29
-
30
-
31
-
32
-
33
-
34
-
35
-
36
-
37
-
38
-
39
-
40
-
41
-
42
-
43
-
44
-
45
-
46
-
47
-
48
-
49
-
50
-
 51
51 -
 52
52 -
 53
53 -
 54
54 -
 55
55 -
 56
56 -
 57
57 -
 58
58 -
 59
59 -
 60
60 -
 61
61 -
 62
62 -
 63
63 -
 64
64 -
 65
65 -
 66
66 -
 67
67 -
 68
68 -
 69
69 -
 70
70 -
 71
71 -
72
-
73
-
74
-
75
-
76
-
77
-
78
-
79
-
80
-
81
-
82
-
83
-
84
-
85
-
86
-
87
-
88
-
89
-
90
-
91
-
92
-
93
-
94
-
95
-
96
-
97
-
98
-
99
-
100
-
101
-
102
-
103
-
104
-
105
-
106
-
107
-
108
-
109
-
110
-
111
-
112
-
113
-
114
-
115
-
116
-
117
-
118
 |
 |

58
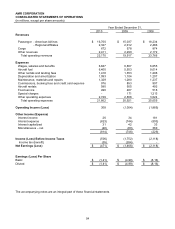
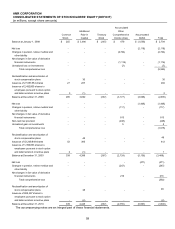
AMR CORPORATION
CONSOLIDATED STATEMENTS OF STOCKHOLDERS' EQUITY (DEFICIT)
(in millions, except share amounts)
Common
Stock
Additional
Paid-
in
Capital
Treasury
Stock
Accumulated
Other
Comprehensive
Income (loss)
Accumulated
Deficit
Total
Balance at January 1, 2008
$ 255
$ 3,696
$ (367)
$ 670
$ (1,550)
$ 2,704
Net loss
-
-
-
-
(2,118)
(2,118)
Changes in pension, retiree medical and
other liability
-
-
-
(2,724)
-
(2,724)
Net changes in fair value of derivative
financial instruments
-
-
-
(1,116)
-
(1,116)
Unrealized loss on investments
-
-
-
(7)
-
(7)
Total comprehensive loss
(5,965)
Reclassification and amortization of
stock compensation plans
-
30
-
-
-
30
Issuance of 27,057,554 shares
27
267
-
-
-
294
Issuance of 2,492,860 shares to
employees pursuant to stock option
and deferred stock incentive plans
3
(1)
-
-
-
2
Balance at December 31, 2008
285
3,992
(367)
(3,177)
(3,668)
(2,935)
Net loss
-
-
-
-
(1,468)
(1,468)
Changes in pension, retiree medical and
other liability
-
-
-
(117)
-
(117)
Net changes in fair value of derivative
financial instruments
-
-
-
813
-
813
Non-cash tax provision
-
-
-
(248)
-
(248)
Unrealized gain on investments
-
-
-
5
-
5
Total comprehensive loss
(1,015)
Reclassification and
amortization of
stock compensation plans
-
48
-
-
-
48
Issuance of 52,269,849 shares
52
360
-
-
-
412
Issuance of 1,399,833 shares to
employees pursuant to stock option
and deferred stock incentive plans
2
(1)
-
-
-
1
Balance at December 31, 2009
339
4,399
(367)
(2,724)
(5,136)
(3,489)
Net loss
-
-
-
-
(471)
(471)
Changes in pension, retiree medical and
other liability
-
-
-
(247)
-
(2
47)
Net changes in fair value of derivative
financial instruments
-
-
-
216
-
216
Total comprehensive loss
(502)
Reclassification and amortization of
stock compensation plans
-
48
-
-
-
48
Issuance
of 825,397 shares to
employees
pursuant to stock option
and deferred stock incentive plans
-
(2)
-
-
-
(2)
Balance at December 31, 2010
339
4,445
(367)
(2,755)
(5,607)
(3,945)
The accompanying notes are an integral part of these financial statements.