American Airlines 2010 Annual Report Download - page 82
Download and view the complete annual report
Please find page 82 of the 2010 American Airlines annual report below. You can navigate through the pages in the report by either clicking on the pages listed below, or by using the keyword search tool below to find specific information within the annual report.-
 1
1 -
2
-
3
-
4
-
5
-
6
-
7
-
8
-
9
-
10
-
11
-
12
-
13
-
14
-
15
-
16
-
17
-
18
-
19
-
20
-
21
-
22
-
23
-
24
-
25
-
26
-
27
-
28
-
29
-
30
-
31
-
32
-
33
-
34
-
35
-
36
-
37
-
38
-
39
-
40
-
41
-
42
-
43
-
44
-
45
-
46
-
47
-
48
-
49
-
50
-
51
-
52
-
53
-
54
-
55
-
56
-
57
-
58
-
59
-
60
-
61
-
62
-
63
-
64
-
65
-
66
-
67
-
68
-
69
-
70
-
71
-
 72
72 -
 73
73 -
 74
74 -
 75
75 -
 76
76 -
 77
77 -
 78
78 -
 79
79 -
 80
80 -
 81
81 -
 82
82 -
 83
83 -
 84
84 -
 85
85 -
 86
86 -
 87
87 -
 88
88 -
 89
89 -
 90
90 -
 91
91 -
 92
92 -
93
-
94
-
95
-
96
-
97
-
98
-
99
-
100
-
101
-
102
-
103
-
104
-
105
-
106
-
107
-
108
-
109
-
110
-
111
-
112
-
113
-
114
-
115
-
116
-
117
-
118
 |
 |

79
10. Retirement Benefits (Continued)
Pension Benefits
Retiree Medical and Other
Benefits
2010
2009
2010
2009
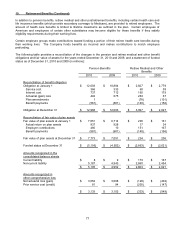
Weighted-average assumptions used to
determine benefit obligations as of
December 31
Discount rate
5.80%
6.10%
5.69%
5.90%
Salary scale (ultimate)
3.78
3.78
-
-
Pension Benefits
Retiree Medical and Other
Benefits
2010
2009
2010
2009
Weighted-average assumptions used to
determine net periodic benefit cost for
the years ended December 31
Discount rate
6.10%
6.50%
5.90%
6.50%
Salary scale (ultimate)
3.78
3.78
-
-
Expected return on plan assets
8.50
8.75
8.50
8.75
As of December 31, 2010, the Company’s estimate of the long-term rate of return on plan assets was 8.50
percent based on the target asset allocation. Expected returns on longer duration bonds are based on yields to
maturity of the bonds held at year-end. Expected returns on other assets are based on a combination of long-
term historical returns, actual returns on plan assets achieved over the last ten years, current and expected
market conditions, and expected value to be generated through active management, currency overlay and
securities lending programs. The Company’s annualized ten-year rate of return on plan assets as of December
31, 2010, was approximately 7.74 percent.
The objectives of the Company’s investment policies are to: maintain sufficient income and liquidity to pay
retirement benefits; produce a long-term rate of return that meets or exceeds the assumed rate of return for plan
assets; limit the volatility of asset performance and funded status; and diversify assets among asset classes and
investment managers.
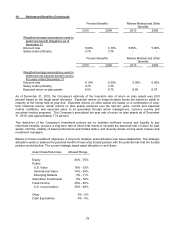
Based on these investment objectives, a long-term strategic asset allocation has been established. This strategic
allocation seeks to balance the potential benefit of improving funded position with the potential risk that the funded
position would decline. The current strategic target asset allocation is as follows:
Asset Class/Sub-Class
Allowed Range
Equity
60% - 70%
Public:
U.S. Value
18% - 33%
International Value
14% - 24%
Emerging Markets
5% - 11%
Alternative Investments
0% - 18%
Fixed Income
30% - 40%
U.S. Long Duration
30% - 40%
Other
0% - 5%
Cash Equivalents
0% - 5%