American Airlines 2010 Annual Report Download - page 42
Download and view the complete annual report
Please find page 42 of the 2010 American Airlines annual report below. You can navigate through the pages in the report by either clicking on the pages listed below, or by using the keyword search tool below to find specific information within the annual report.-
 1
1 -
2
-
3
-
4
-
5
-
6
-
7
-
8
-
9
-
10
-
11
-
12
-
13
-
14
-
15
-
16
-
17
-
18
-
19
-
20
-
21
-
22
-
23
-
24
-
25
-
26
-
27
-
28
-
29
-
30
-
31
-
 32
32 -
 33
33 -
 34
34 -
 35
35 -
 36
36 -
 37
37 -
 38
38 -
 39
39 -
 40
40 -
 41
41 -
 42
42 -
 43
43 -
 44
44 -
 45
45 -
 46
46 -
 47
47 -
 48
48 -
 49
49 -
 50
50 -
 51
51 -
 52
52 -
53
-
54
-
55
-
56
-
57
-
58
-
59
-
60
-
61
-
62
-
63
-
64
-
65
-
66
-
67
-
68
-
69
-
70
-
71
-
72
-
73
-
74
-
75
-
76
-
77
-
78
-
79
-
80
-
81
-
82
-
83
-
84
-
85
-
86
-
87
-
88
-
89
-
90
-
91
-
92
-
93
-
94
-
95
-
96
-
97
-
98
-
99
-
100
-
101
-
102
-
103
-
104
-
105
-
106
-
107
-
108
-
109
-
110
-
111
-
112
-
113
-
114
-
115
-
116
-
117
-
118
 |
 |

39
Revenues
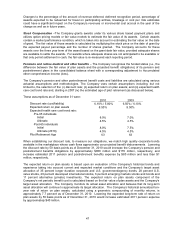
2010 Compared to 2009 The Company’s revenues increased approximately $2.3 billion, or 11.3 percent, to
$22.2 billion in 2010 compared to 2009 due to increased traffic and higher average fares. American’s passenger
revenues increased by 11.5 percent, or $1.7 billion, on a capacity (ASM) increase of 1.0 percent. American’s
passenger load factor increased approximately 1.2 points to 81.9 percent and passenger revenue yield per
passenger mile increased 8.7 percent to 13.36 cents. This resulted in an increase in passenger revenue per
available seat mile (RASM) of 10.4 percent to 10.94 cents. In 2010, American derived approximately 60 percent
of its passenger revenues from domestic operations and approximately 40 percent from international operations
(flights serving international destinations). Following is additional information regarding American’s domestic and
international RASM and capacity:
Year Ended December 31, 2010
RASM
(cents)
Y-O-Y
Change
ASMs
(billions)
Y-O-Y
Change
DOT Domestic
10.80
9.5%
93.2
0.2%
International
11.14
11.8
60.0
2.2
DOT Latin America
11.80
8.1
29.4
3.7
DOT Atlantic
10.58
15.9
23.2
(1.9)
DOT Pacific
10.29
15.7
7.4
9.8
Regional Affiliates’ passenger revenues, which are based on industry standard proration agreements for flights
connecting to American flights, increased $315 million or 15.7 percent as a result of passenger yield increase of
8.4 percent. Regional Affiliates’ traffic increased 6.7 percent to 8.8 billion revenue passenger miles (RPMs), while
capacity increased 5.3 percent to 12.2 billion ASMs, resulting in a 1.0 point increase in passenger load factor to
72.4 percent.
Cargo revenues increased 16.3 percent, or $94 million, primarily as a result of increased volume, particularly in
the Latin America and Pacific regions.
Other revenues increased 5.3 percent, or $121 million, to $2.4 billion due to increases in certain passenger
service charge volumes and fees and increased revenue associated with the sale of mileage credits in the
AAdvantage frequent flyer program.