American Airlines 2010 Annual Report Download - page 91
Download and view the complete annual report
Please find page 91 of the 2010 American Airlines annual report below. You can navigate through the pages in the report by either clicking on the pages listed below, or by using the keyword search tool below to find specific information within the annual report.-
 1
1 -
2
-
3
-
4
-
5
-
6
-
7
-
8
-
9
-
10
-
11
-
12
-
13
-
14
-
15
-
16
-
17
-
18
-
19
-
20
-
21
-
22
-
23
-
24
-
25
-
26
-
27
-
28
-
29
-
30
-
31
-
32
-
33
-
34
-
35
-
36
-
37
-
38
-
39
-
40
-
41
-
42
-
43
-
44
-
45
-
46
-
47
-
48
-
49
-
50
-
51
-
52
-
53
-
54
-
55
-
56
-
57
-
58
-
59
-
60
-
61
-
62
-
63
-
64
-
65
-
66
-
67
-
68
-
69
-
70
-
71
-
72
-
73
-
74
-
75
-
76
-
77
-
78
-
79
-
80
-
 81
81 -
 82
82 -
 83
83 -
 84
84 -
 85
85 -
 86
86 -
 87
87 -
 88
88 -
 89
89 -
 90
90 -
 91
91 -
 92
92 -
 93
93 -
 94
94 -
 95
95 -
 96
96 -
 97
97 -
 98
98 -
 99
99 -
 100
100 -
 101
101 -
102
-
103
-
104
-
105
-
106
-
107
-
108
-
109
-
110
-
111
-
112
-
113
-
114
-
115
-
116
-
117
-
118
 |
 |

88
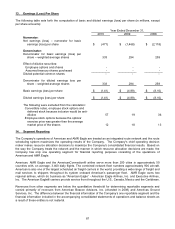
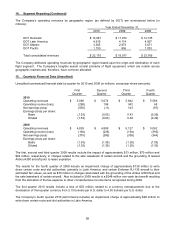
14. Segment Reporting (Continued)
The Company’s operating revenues by geographic region (as defined by DOT) are summarized below (in
millions):
Year Ended December 31,
2010
2009
2008
DOT Domestic
$ 13,081
$ 11,974
$ 14,135
DOT Latin America
4,619
4,114
4,927
DOT Atlantic
3,365
2,973
3,671
DOT Pacific
1,105
856
1,033
Total consolidated revenues
$ 22,170
$ 19,917
$ 23,766
The Company attributes operating revenues by geographic region based upon the origin and destination of each
flight segment. The Company’s tangible assets consist primarily of flight equipment, which are mobile across
geographic markets and, therefore, have not been allocated.
15. Quarterly Financial Data (Unaudited)
Unaudited summarized financial data by quarter for 2010 and 2009 (in millions, except per share amounts):
First
Quarter
Second
Quarter
Third
Quarter
Fourth
Quarter
2010
Operating revenues
$ 5,068
$ 5,674
$ 5,842
$ 5,586
Operating income (loss)
(298)
196
342
68
Net earnings (loss)
(505)
(11)
143
(97)
Earnings (loss) per share:
Basic
(1.52)
(0.03)
0.43
(0.29)
Diluted
(1.52)
(0.03)
0.39
(0.29)
2009
Operating revenues
$ 4,839
$ 4,889
$ 5,127
$ 5,062
Operating income (loss)
(194)
(226)
(194)
(390)
Net earnings (loss)
(375)
(390)
(359)
(344)
Earnings (loss) per share:
Basic
(1.35)
(1.39)
(1.26)
(1.03)
Diluted
(1.35)
(1.39)
(1.26)
(1.03)
The first, second and third quarter 2009 results include the impact of approximately $13 million, $70 million and
$94 million, respectively, in charges related to the sale leaseback of certain aircraft and the grounding of leased
Airbus A300 aircraft prior to lease expiration.
The results for the fourth quarter of 2009 include an impairment charge of approximately $138 million to write
down certain route and slot authorities, primarily in Latin America, and certain Embraer RJ-135 aircraft to their
estimated fair values, as well as $30 million in charges associated with the grounding of the Airbus A300 fleet and
the sale leaseback of certain aircraft. Also included in 2009 results is a $248 million non-cash tax benefit resulting
from the allocation of the tax expense to other comprehensive income items recognized during 2009.
The first quarter 2010 results include a loss of $53 million related to a currency remeasurement due to the
devaluation of Venezuelan currency from 2.15 bolivars per U.S. dollar to 4.30 bolivars per U.S. dollar.
The Company’s fourth quarter 2010 performance includes an impairment charge of approximately $28 million to
write down certain route and slot authorities in Latin America.