American Airlines 2010 Annual Report Download - page 41
Download and view the complete annual report
Please find page 41 of the 2010 American Airlines annual report below. You can navigate through the pages in the report by either clicking on the pages listed below, or by using the keyword search tool below to find specific information within the annual report.-
 1
1 -
2
-
3
-
4
-
5
-
6
-
7
-
8
-
9
-
10
-
11
-
12
-
13
-
14
-
15
-
16
-
17
-
18
-
19
-
20
-
21
-
22
-
23
-
24
-
25
-
26
-
27
-
28
-
29
-
30
-
 31
31 -
 32
32 -
 33
33 -
 34
34 -
 35
35 -
 36
36 -
 37
37 -
 38
38 -
 39
39 -
 40
40 -
 41
41 -
 42
42 -
 43
43 -
 44
44 -
 45
45 -
 46
46 -
 47
47 -
 48
48 -
 49
49 -
 50
50 -
 51
51 -
52
-
53
-
54
-
55
-
56
-
57
-
58
-
59
-
60
-
61
-
62
-
63
-
64
-
65
-
66
-
67
-
68
-
69
-
70
-
71
-
72
-
73
-
74
-
75
-
76
-
77
-
78
-
79
-
80
-
81
-
82
-
83
-
84
-
85
-
86
-
87
-
88
-
89
-
90
-
91
-
92
-
93
-
94
-
95
-
96
-
97
-
98
-
99
-
100
-
101
-
102
-
103
-
104
-
105
-
106
-
107
-
108
-
109
-
110
-
111
-
112
-
113
-
114
-
115
-
116
-
117
-
118
 |
 |

38
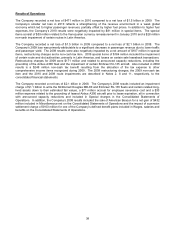
Results of Operations
The Company recorded a net loss of $471 million in 2010 compared to a net loss of $1.5 billion in 2009. The
Company’s smaller net loss in 2010 reflects a strengthening of the revenue environment in a weak global
economy which led to higher passenger revenues, partially offset by higher fuel prices. In addition to higher fuel
expenses, the Company’s 2010 results were negatively impacted by $81 million in special items. The special
items consist of $53 million related to the Venezuelan currency remeasurement in January 2010 and a $28 million
non-cash impairment of certain routes in Latin America.
The Company recorded a net loss of $1.5 billion in 2009 compared to a net loss of $2.1 billion in 2008. The
Company’s 2009 loss was primarily attributable to a significant decrease in passenger revenue due to lower traffic
and passenger yield. The 2009 results were also negatively impacted by a net amount of $107 million in special
items, restructuring charges and a non-cash tax item. 2009 special items of $184 million included the impairment
of certain route and slot authorities, primarily in Latin America, and losses on certain sale leaseback transactions.
Restructuring charges for 2009 were $171 million and related to announced capacity reductions, including the
grounding of the Airbus A300 fleet and the impairment of certain Embraer RJ-135 aircraft. Also included in 2009
results is a $248 million non-cash tax benefit resulting from the allocation of the tax expense to other
comprehensive income items recognized during 2009. The 2009 restructuring charges, the 2009 non-cash tax
item and the 2010 and 2009 route impairments are described in Notes 2, 8 and 11, respectively, to the
consolidated financial statements.
The Company recorded a net loss of $2.1 billion in 2008. The Company’s 2008 results included an impairment
charge of $1.1 billion to write the McDonnell Douglas MD-80 and Embraer RJ-135 fleets and certain related long-
lived assets down to their estimated fair values, a $71 million accrual for employee severance cost and a $33
million expense related to the grounding of leased Airbus A300 aircraft prior to lease expiration, all in connection
with announced capacity reductions and included in Special charges in the Consolidated Statements of
Operations. In addition, the Company’s 2008 results included the sale of American Beacon for a net gain of $432
million included in Miscellaneous-net on the Consolidated Statements of Operations and the impact of a pension
settlement charge of $103 million for one of the Company’s defined benefit plans included in Wages, salaries and
benefits on the Consolidated Statements of Operations.