American Airlines 2010 Annual Report Download - page 90
Download and view the complete annual report
Please find page 90 of the 2010 American Airlines annual report below. You can navigate through the pages in the report by either clicking on the pages listed below, or by using the keyword search tool below to find specific information within the annual report.-
 1
1 -
2
-
3
-
4
-
5
-
6
-
7
-
8
-
9
-
10
-
11
-
12
-
13
-
14
-
15
-
16
-
17
-
18
-
19
-
20
-
21
-
22
-
23
-
24
-
25
-
26
-
27
-
28
-
29
-
30
-
31
-
32
-
33
-
34
-
35
-
36
-
37
-
38
-
39
-
40
-
41
-
42
-
43
-
44
-
45
-
46
-
47
-
48
-
49
-
50
-
51
-
52
-
53
-
54
-
55
-
56
-
57
-
58
-
59
-
60
-
61
-
62
-
63
-
64
-
65
-
66
-
67
-
68
-
69
-
70
-
71
-
72
-
73
-
74
-
75
-
76
-
77
-
78
-
79
-
 80
80 -
 81
81 -
 82
82 -
 83
83 -
 84
84 -
 85
85 -
 86
86 -
 87
87 -
 88
88 -
 89
89 -
 90
90 -
 91
91 -
 92
92 -
 93
93 -
 94
94 -
 95
95 -
 96
96 -
 97
97 -
 98
98 -
 99
99 -
 100
100 -
101
-
102
-
103
-
104
-
105
-
106
-
107
-
108
-
109
-
110
-
111
-
112
-
113
-
114
-
115
-
116
-
117
-
118
 |
 |

87
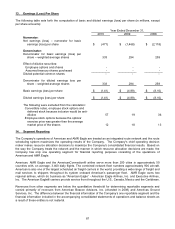
13. Earnings (Loss) Per Share
The following table sets forth the computation of basic and diluted earnings (loss) per share (in millions, except
per share amounts):
Year Ended December 31,
2010
2009
2008
Numerator:
Net earnings (loss) – numerator for basic
earnings (loss) per share
$ (471)
$ (1,468)
$ (2,118)
Denominator:
Denominator for basic earnings (loss) per
share – weighted average shares
333
294
259
Effect of dilutive securities:
Employee options and shares
-
-
-
Assumed treasury shares purchased
-
-
-
Diluted potential common shares
-
-
-
Denominator for diluted earnings loss per
share – weighted-average shares
333
294
259
Basic earnings (loss) per share
$ (1.41)
$ (4.99)
$ (8.16)
Diluted earnings (loss) per share
$ (1.41)
$ (4.99)
$ (8.16)
The following were excluded from the calculation:
Convertible notes, employee stock options and
deferred stock because inclusion would be anti-
dilutive
57
19
36
Employee stock options because the options’
exercise price was greater than the average
market price of the shares
12
18
13
14. Segment Reporting
The Company's operations of American and AMR Eagle are treated as an integrated route network and the route
scheduling system maximizes the operating results of the Company. The Company's chief operating decision
maker makes resource allocation decisions to maximize the Company's consolidated financial results. Based on
the way the Company treats the network and the manner in which resource allocation decisions are made, the
Company has only one operating segment for financial reporting purposes consisting of the operations of
American and AMR Eagle.
American, AMR Eagle and the AmericanConnection® airline serve more than 250 cities in approximately 50
countries with, on average, 3,400 daily flights. The combined network fleet numbers approximately 900 aircraft.
American is also one of the largest scheduled air freight carriers in the world, providing a wide range of freight and
mail services to shippers throughout its system onboard American’s passenger fleet. AMR Eagle owns two
regional airlines, which do business as "American Eagle” - American Eagle Airlines, Inc. and Executive Airlines,
Inc. The American Eagle® carriers provide service from throughout the U.S., Canada, Mexico and the Caribbean.
Revenues from other segments are below the quantitative threshold for determining reportable segments and
consist primarily of revenues from American Beacon Advisors, Inc. (divested in 2008) and Americas Ground
Services, Inc. The difference between the financial information of the Company’s one reportable segment and the
financial information included in the accompanying consolidated statements of operations and balance sheets as
a result of these entities is not material.