American Airlines 2010 Annual Report Download - page 83
Download and view the complete annual report
Please find page 83 of the 2010 American Airlines annual report below. You can navigate through the pages in the report by either clicking on the pages listed below, or by using the keyword search tool below to find specific information within the annual report.-
 1
1 -
2
-
3
-
4
-
5
-
6
-
7
-
8
-
9
-
10
-
11
-
12
-
13
-
14
-
15
-
16
-
17
-
18
-
19
-
20
-
21
-
22
-
23
-
24
-
25
-
26
-
27
-
28
-
29
-
30
-
31
-
32
-
33
-
34
-
35
-
36
-
37
-
38
-
39
-
40
-
41
-
42
-
43
-
44
-
45
-
46
-
47
-
48
-
49
-
50
-
51
-
52
-
53
-
54
-
55
-
56
-
57
-
58
-
59
-
60
-
61
-
62
-
63
-
64
-
65
-
66
-
67
-
68
-
69
-
70
-
71
-
72
-
 73
73 -
 74
74 -
 75
75 -
 76
76 -
 77
77 -
 78
78 -
 79
79 -
 80
80 -
 81
81 -
 82
82 -
 83
83 -
 84
84 -
 85
85 -
 86
86 -
 87
87 -
 88
88 -
 89
89 -
 90
90 -
 91
91 -
 92
92 -
 93
93 -
94
-
95
-
96
-
97
-
98
-
99
-
100
-
101
-
102
-
103
-
104
-
105
-
106
-
107
-
108
-
109
-
110
-
111
-
112
-
113
-
114
-
115
-
116
-
117
-
118
 |
 |

80
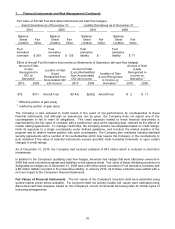
10. Retirement Benefits (Continued)
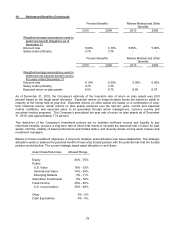
Each asset class is actively managed and, historically, the plans’ assets have produced returns, net of
management fees, in excess of the expected rate of return over the last ten years. Stocks and emerging market
bonds are used to provide diversification and are expected to generate higher returns over the long-term than
longer duration U.S. bonds. Public stocks are managed using a value investment approach in order to participate
in the returns generated by stocks in the long-term, while reducing year-over-year volatility. Longer duration U.S.
bonds are used to partially hedge the assets from declines in interest rates. Alternative (private) investments are
used to provide expected returns in excess of the public markets over the long-term. Additionally, the Company
engages currency overlay managers in an attempt to increase returns by protecting non-U.S. dollar denominated
assets from a rise in the relative value of the U.S. dollar. The Company also participates in securities lending
programs to generate additional income by loaning plan assets to borrowers on a fully collateralized basis. These
programs are subject to market risk.
Investments in securities traded on recognized securities exchanges are valued at the last reported sales price on
the last business day of the year. Securities traded in the over-the-counter market are valued at the last bid price.
The money market fund is valued at fair value which represents the net asset value of the shares of such fund as
of the close of business at the end of the period. Investments in limited partnerships are carried at estimated net
asset value as determined by and reported by the general partners of the partnerships and represent the
proportionate share of the estimated fair value of the underlying assets of the limited partnerships.
Common/collective trusts are valued at net asset value based on the fair values of the underlying investments of
the trusts as determined by the sponsor of the trusts. The 103-12 investment trust is valued at net asset value
which is determined by the issuer at the end of each month and is based on the aggregate fair value of trust
assets less liabilities, divided by the number of units outstanding. No changes in valuation techniques or inputs
occurred during the period.
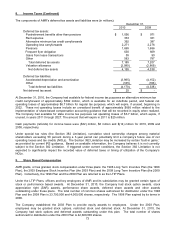
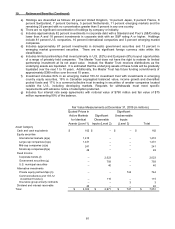
The fair values of the Company’s pension plan assets at December 31, 2010 and 2009, by asset category are as
follows:
Fair Value Measurements at December 31, 2010 (in millions)
Quoted Prices in
Active Markets
for Identical
Assets (Level 1)
Significant
Observable
Inputs (Level 2)
Significant
Unobservable
Inputs
(Level 3)
Total
Asset Category
Cash and cash equivalents
$ 269
$ –
$ –
$ 269
Equity securities
International markets (a)(b)
2,025
–
–
2,025
Large-cap companies (b)
1,557
–
–
1,557
Mid-cap companies (b)
152
–
–
152
Small-cap companies(b)
37
–
–
37
Fixed Income
Corporate bonds (c)
–
1,593
–
1,593
Government securities (d)
–
1,194
–
1,194
U.S. municipal securities
–
39
–
39
Alternative investments
Private equity partnerships (e)
–
–
795
795
Common/collective and 103-12
investment trusts (f)
–
145
–
145
Interest rate swap contracts – net(g)
–
(74)
–
(74)
Insurance group annuity contracts
–
–
3
3
Dividend and interest receivable
37
–
–
37
Due to/from brokers for sale of securities -
net
(11)
–
–
(11)
Swap income receivable
8
–
–
8
Other assets – net
4
–
–
4
Total
$ 4,078
$ 2,897
$ 798
$ 7,773