American Airlines 2010 Annual Report Download - page 50
Download and view the complete annual report
Please find page 50 of the 2010 American Airlines annual report below. You can navigate through the pages in the report by either clicking on the pages listed below, or by using the keyword search tool below to find specific information within the annual report.-
 1
1 -
2
-
3
-
4
-
5
-
6
-
7
-
8
-
9
-
10
-
11
-
12
-
13
-
14
-
15
-
16
-
17
-
18
-
19
-
20
-
21
-
22
-
23
-
24
-
25
-
26
-
27
-
28
-
29
-
30
-
31
-
32
-
33
-
34
-
35
-
36
-
37
-
38
-
39
-
 40
40 -
 41
41 -
 42
42 -
 43
43 -
 44
44 -
 45
45 -
 46
46 -
 47
47 -
 48
48 -
 49
49 -
 50
50 -
 51
51 -
 52
52 -
 53
53 -
 54
54 -
 55
55 -
 56
56 -
 57
57 -
 58
58 -
 59
59 -
 60
60 -
61
-
62
-
63
-
64
-
65
-
66
-
67
-
68
-
69
-
70
-
71
-
72
-
73
-
74
-
75
-
76
-
77
-
78
-
79
-
80
-
81
-
82
-
83
-
84
-
85
-
86
-
87
-
88
-
89
-
90
-
91
-
92
-
93
-
94
-
95
-
96
-
97
-
98
-
99
-
100
-
101
-
102
-
103
-
104
-
105
-
106
-
107
-
108
-
109
-
110
-
111
-
112
-
113
-
114
-
115
-
116
-
117
-
118
 |
 |

47
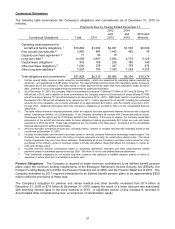
Changes to the percentage of the amount of revenue deferred, deferred recognition period, percentage of
awards expected to be redeemed for travel on participating airlines, breakage or cost per mile estimates
could have a significant impact on the Company’s revenues or incremental cost accrual in the year of the
change as well as in future years.
Stock Compensation –The Company grants awards under its various share based payment plans and
utilizes option pricing models or fair value models to estimate the fair value of its awards. Certain awards
contain a market performance condition, which is taken into account in estimating the fair value on the date
of grant. The fair value of those awards is calculated by multiplying the stock price on the date of grant by
the expected payout percentage and the number of shares granted. The Company accounts for these
awards over the three year term of the award based on the grant date fair value, provided adequate shares
are available to settle the awards. For awards where adequate shares are not anticipated to be available or
that only permit settlement in cash, the fair value is re-measured each reporting period.
Pensions and retiree medical and other benefits – The Company recognizes the funded status (i.e., the
difference between the fair value of plan assets and the projected benefit obligations) of its pension and
postretirement plans in the consolidated balance sheet with a corresponding adjustment to Accumulated
other comprehensive income (loss).
The Company’s pension and other postretirement benefit costs and liabilities are calculated using various
actuarial assumptions and methodologies. The Company uses certain assumptions including, but not
limited to, the selection of the: (i) discount rate; (ii) expected return on plan assets; and (iii) expected health
care cost trend rate and, starting in 2007 (iv) the estimated age of pilot retirement (as discussed below).
These assumptions as of December 31 were:
2010
2009
Discount rate (cost/liability)
6.10% / 5.80%
6.50% / 6.10%
Expected return on plan assets
8.50%
8.50%
Expected health care cost trend rate:
Pre-65 individuals
Initial
8.0%
7.0%
Ultimate
4.5%
4.5%
Post-65 individuals
Initial
8.0%
7.5%
Ultimate (2010)
4.5%
4.5%
Pilot Retirement Age
63
63
When establishing our discount rate, to measure our obligations, we match high quality corporate bonds
available in the marketplace whose cash flows approximate our projected benefit disbursements. Lowering
the discount rate by 50 basis points as of December 31, 2010 would increase the Company’s pension and
postretirement benefits obligations by approximately $850 million and $170 million, respectively, and
increase estimated 2011 pension and postretirement benefits expense by $80 million and less than $1
million, respectively.
The expected return on plan assets is based upon an evaluation of the Company's historical trends and
experience taking into account current and expected market conditions and the Company’s target asset
allocation of 35 percent longer duration corporate and U.S. government/agency bonds, 28 percent U.S.
value stocks, 20 percent developed international stocks, 6 percent emerging markets stocks and bonds and
11 percent alternative (private) investments. The expected return on plan assets component of the
Company’s net periodic benefit cost is calculated based on the fair value of plan assets and the Company’s
target asset allocation. The Company monitors its actual asset allocation and believes that its long-term
asset allocation will continue to approximate its target allocation. The Company’s historical annualized ten-
year rate of return on plan assets, calculated using a geometric compounding of monthly returns, is
approximately 7.7 percent as of December 31, 2010. Lowering the expected long-term rate of return on
plan assets by 50 basis points as of December 31, 2010 would increase estimated 2011 pension expense
by approximately $40 million.