American Airlines 2010 Annual Report Download - page 81
Download and view the complete annual report
Please find page 81 of the 2010 American Airlines annual report below. You can navigate through the pages in the report by either clicking on the pages listed below, or by using the keyword search tool below to find specific information within the annual report.-
 1
1 -
2
-
3
-
4
-
5
-
6
-
7
-
8
-
9
-
10
-
11
-
12
-
13
-
14
-
15
-
16
-
17
-
18
-
19
-
20
-
21
-
22
-
23
-
24
-
25
-
26
-
27
-
28
-
29
-
30
-
31
-
32
-
33
-
34
-
35
-
36
-
37
-
38
-
39
-
40
-
41
-
42
-
43
-
44
-
45
-
46
-
47
-
48
-
49
-
50
-
51
-
52
-
53
-
54
-
55
-
56
-
57
-
58
-
59
-
60
-
61
-
62
-
63
-
64
-
65
-
66
-
67
-
68
-
69
-
70
-
 71
71 -
 72
72 -
 73
73 -
 74
74 -
 75
75 -
 76
76 -
 77
77 -
 78
78 -
 79
79 -
 80
80 -
 81
81 -
 82
82 -
 83
83 -
 84
84 -
 85
85 -
 86
86 -
 87
87 -
 88
88 -
 89
89 -
 90
90 -
 91
91 -
92
-
93
-
94
-
95
-
96
-
97
-
98
-
99
-
100
-
101
-
102
-
103
-
104
-
105
-
106
-
107
-
108
-
109
-
110
-
111
-
112
-
113
-
114
-
115
-
116
-
117
-
118
 |
 |

78
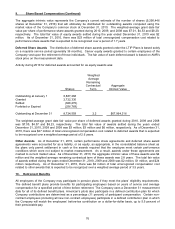
10. Retirement Benefits (Continued)
For plans with accumulated benefit
obligations exceeding the fair value
of plan assets
Pension Benefits
Retiree Medical and Other
Benefits
2010
2009
2010
2009
Projected benefit obligation (PBO)
$ 12,968
$ 11,977
$ -
$ -
Accumulated benefit obligation (ABO)
11,508
10,558
-
-
Accumulated postretirement benefit
obligation (APBO)
-
-
3,097
2,827
Fair value of plan assets
7,773
7,027
234
206
ABO less fair value of plan assets
3,735
3,531
-
-
At December 31, 2010 and 2009, pension benefit plan assets of $264 million and $145 million, respectively, and
retiree medical and other benefit plan assets of $232 million and $204 million, respectively, were invested in
shares of certain mutual funds.
The following tables provide the components of net periodic benefit cost for the years ended December 31, 2010,
2009 and 2008 (in millions):
Pension Benefits
2010
2009
2008
Components of net periodic benefit cost
Defined benefit plans:
Service cost
$ 366
$ 333
$ 324
Interest cost
737
712
684
Expected return on assets
(593)
(566)
(789)
Amortization of:
Prior service cost
13
13
16
Settlement
-
-
103
Unrecognized net loss
154
145
3
Net periodic benefit cost for
defined benefit plans
677
637
341
Defined contribution plans
168
168
170
$ 845
$ 805
$ 511
Retiree Medical and Other Benefits
2010
2009
2008
Components of net periodic benefit cost
Service cost
$ 60
$ 59
$ 54
Interest cost
165
179
172
Expected return on assets
(18)
(14)
(20)
Amortization of:
Prior service cost
(19)
(8)
(13)
Unrecognized net loss (gain)
(10)
(14)
(22)
Net periodic benefit cost
$ 178
$ 202
$ 171
The estimated net loss and prior service cost for the defined benefit pension plans that will be amortized from
Accumulated other comprehensive income into net periodic benefit cost over the next fiscal year are $154 million
and $13 million, respectively. The estimated net gain and prior service credit for the retiree medical and other
postretirement plans that will be amortized from Accumulated other comprehensive income into net periodic
benefit cost over the next fiscal year are $9 million and $29 million, respectively.