American Airlines 2010 Annual Report Download - page 85
Download and view the complete annual report
Please find page 85 of the 2010 American Airlines annual report below. You can navigate through the pages in the report by either clicking on the pages listed below, or by using the keyword search tool below to find specific information within the annual report.-
 1
1 -
2
-
3
-
4
-
5
-
6
-
7
-
8
-
9
-
10
-
11
-
12
-
13
-
14
-
15
-
16
-
17
-
18
-
19
-
20
-
21
-
22
-
23
-
24
-
25
-
26
-
27
-
28
-
29
-
30
-
31
-
32
-
33
-
34
-
35
-
36
-
37
-
38
-
39
-
40
-
41
-
42
-
43
-
44
-
45
-
46
-
47
-
48
-
49
-
50
-
51
-
52
-
53
-
54
-
55
-
56
-
57
-
58
-
59
-
60
-
61
-
62
-
63
-
64
-
65
-
66
-
67
-
68
-
69
-
70
-
71
-
72
-
73
-
74
-
 75
75 -
 76
76 -
 77
77 -
 78
78 -
 79
79 -
 80
80 -
 81
81 -
 82
82 -
 83
83 -
 84
84 -
 85
85 -
 86
86 -
 87
87 -
 88
88 -
 89
89 -
 90
90 -
 91
91 -
 92
92 -
 93
93 -
 94
94 -
 95
95 -
96
-
97
-
98
-
99
-
100
-
101
-
102
-
103
-
104
-
105
-
106
-
107
-
108
-
109
-
110
-
111
-
112
-
113
-
114
-
115
-
116
-
117
-
118
 |
 |

82
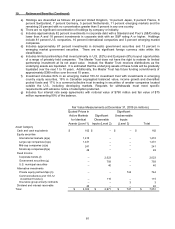
10. Retirement Benefits (Continued)
a) Holdings are diversified as follows: 20 percent United Kingdom, 14 percent Japan, 12 percent France, 10
percent Germany, 9 percent Switzerland, 6 percent Netherlands, 6 percent emerging markets and the
remaining 23 percent with no concentration greater than 5 percent in any one country.
b) Holdings include 85 percent U.S. companies, 11 percent international companies and 4 percent emerging
market companies traded in the U.S. markets.
c) Holdings include 85 percent U.S. companies, 13 percent international companies and 2 percent emerging
market companies traded in the U.S. markets.
d) Holdings include 92 percent U.S. companies, 5 percent international companies and 3 percent emerging
market companies traded in the U.S. markets.
e) There are no significant concentration of holdings by company or industry.
f) Includes approximately 76 percent investments in corporate debt with a Standard and Poor’s (S&P) rating
lower than A and 24 percent investments in corporate debt with an S&P rating A or higher. Holdings
include 81 percent U.S. companies, 17 percent international companies and 2 percent emerging market
companies.
g) Includes approximately 80 percent investments in domestic government securities, 19 percent in
emerging market government securities and 1 percent in other international government securities.
There are no significant foreign currency risks within this classification.
h) Includes limited partnerships that invest primarily in U.S. (93 percent) and European (7 percent) buyout
opportunities.
i) Includes investments in emerging markets, global small companies and Canadian segregated funds.
Not included in the above tables are receivables and payables for foreign currency forward contracts and futures
contracts which net to approximately $3 million and collateral held on loaned securities and the obligation to
return collateral on loaned securities which effectively net to zero.
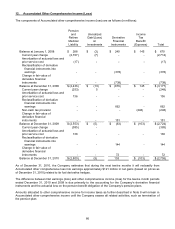
Changes in fair value measurements of Level 3 investments during the year ended December 31, 2010, were as
follows:
Private Equity
Partnerships
Insurance Group
Annuity Contracts
Beginning balance at December 31, 2009
$ 744
$ 3
Actual return on plan assets:
Relating to assets still held at the reporting date
1
-
Relating to assets sold during the period
69
-
Purchases, sales, settlements (net)
(19)
-
Ending balance at December 31, 2010
$ 795
$ 3
Changes in fair value measurements of Level 3 investments during the year ended December 31, 2009, were as
follows:
Private Equity
Partnerships
Insurance Group
Annuity Contracts
Beginning balance at December 31, 2008
$ 613
$ 3
Actual return on plan assets:
Relating to assets still held at the reporting date
47
-
Relating to assets sold during the period
1
-
Purchases, sales, settlements (net)
83
-
Ending balance at December 31, 2009
$ 744
$ 3