American Airlines 2010 Annual Report Download - page 47
Download and view the complete annual report
Please find page 47 of the 2010 American Airlines annual report below. You can navigate through the pages in the report by either clicking on the pages listed below, or by using the keyword search tool below to find specific information within the annual report.-
 1
1 -
2
-
3
-
4
-
5
-
6
-
7
-
8
-
9
-
10
-
11
-
12
-
13
-
14
-
15
-
16
-
17
-
18
-
19
-
20
-
21
-
22
-
23
-
24
-
25
-
26
-
27
-
28
-
29
-
30
-
31
-
32
-
33
-
34
-
35
-
36
-
 37
37 -
 38
38 -
 39
39 -
 40
40 -
 41
41 -
 42
42 -
 43
43 -
 44
44 -
 45
45 -
 46
46 -
 47
47 -
 48
48 -
 49
49 -
 50
50 -
 51
51 -
 52
52 -
 53
53 -
 54
54 -
 55
55 -
 56
56 -
 57
57 -
58
-
59
-
60
-
61
-
62
-
63
-
64
-
65
-
66
-
67
-
68
-
69
-
70
-
71
-
72
-
73
-
74
-
75
-
76
-
77
-
78
-
79
-
80
-
81
-
82
-
83
-
84
-
85
-
86
-
87
-
88
-
89
-
90
-
91
-
92
-
93
-
94
-
95
-
96
-
97
-
98
-
99
-
100
-
101
-
102
-
103
-
104
-
105
-
106
-
107
-
108
-
109
-
110
-
111
-
112
-
113
-
114
-
115
-
116
-
117
-
118
 |
 |

44
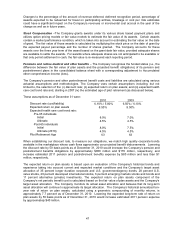
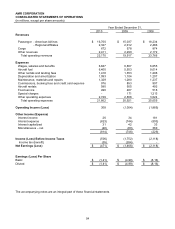
Operating Statistics
The following table provides statistical information for American and Regional Affiliates for the years ended
December 31, 2010, 2009 and 2008.
Year Ended December 31,
2010
2009
2008
American Airlines, Inc. Mainline Jet Operations
Revenue passenger miles (millions)
125,486
122,418
131,757
Available seat miles (millions)
153,241
151,774
163,532
Cargo ton miles (millions)
1,886
1,656
2,005
Passenger load factor
81.9%
80.7%
80.6%
Passenger revenue yield per passenger mile (cents)
13.36
12.28
13.84
Passenger revenue per available seat mile (cents)
10.94
9.91
11.15
Cargo revenue yield per ton mile (cents)
35.65
34.91
43.59
Operating expenses per available seat mile, excluding
Regional Affiliates (cents) (*)
12.62
12.22
13.87
Fuel consumption (gallons, in millions)
2,481
2,499
2,694
Fuel price per gallon (cents)
231.0
200.7
302.6
Operating aircraft at year-end
620
610
626
Regional Affiliates
Revenue passenger miles (millions)
8,812
8,255
8,846
Available seat miles (millions)
12,179
11,566
12,603
Passenger load factor
72.4%
71.4%
70.2%
(*) Excludes $2.7 billion, $2.5 billion and $3.1 billion of expense incurred related to Regional Affiliates in 2010, 2009 and
2008, respectively
Outlook
The Company currently expects capacity for American’s mainline jet operations to increase by approximately
3.8% in the first quarter of 2011 versus first quarter 2010. American’s mainline capacity for the full year 2011 is
expected to increase approximately 3.6% from 2010 with a 1% increase in domestic capacity and a 7.7% growth
in international capacity.
The Company expects first quarter 2011 mainline unit costs to increase approximately 1.6 percent year over year.
The first quarter 2011 unit cost expectations reflect the increase in the cost of fuel during the second half of 2010
and projected fuel prices in 2011. Despite anticipated higher revenue-related expenses (such as booking fees
and commissions) and financing costs related to the Company’s new Boeing 737-800 aircraft, the Company
expects first quarter mainline unit costs excluding fuel to be 3.2% lower than the prior year periods.
The Company’s results are significantly affected by the price of jet fuel, which is in turn affected by a number of
factors beyond the Company’s control. Although fuel prices abated considerably from the record high prices
recorded in July 2008, they have increased since the first quarter of 2009, particularly recently, and remain high
and extremely volatile by historical standards.