American Express 2004 Annual Report Download - page 100
Download and view the complete annual report
Please find page 100 of the 2004 American Express annual report below. You can navigate through the pages in the report by either clicking on the pages listed below, or by using the keyword search tool below to find specific information within the annual report.-
 1
1 -
2
-
3
-
4
-
5
-
6
-
7
-
8
-
9
-
10
-
11
-
12
-
13
-
14
-
15
-
16
-
17
-
18
-
19
-
20
-
21
-
22
-
23
-
24
-
25
-
26
-
27
-
28
-
29
-
30
-
31
-
32
-
33
-
34
-
35
-
36
-
37
-
38
-
39
-
40
-
41
-
42
-
43
-
44
-
45
-
46
-
47
-
48
-
49
-
50
-
51
-
52
-
53
-
54
-
55
-
56
-
57
-
58
-
59
-
60
-
61
-
62
-
63
-
64
-
65
-
66
-
67
-
68
-
69
-
70
-
71
-
72
-
73
-
74
-
75
-
76
-
77
-
78
-
79
-
80
-
81
-
82
-
83
-
84
-
85
-
86
-
87
-
88
-
89
-
 90
90 -
 91
91 -
 92
92 -
 93
93 -
 94
94 -
 95
95 -
 96
96 -
 97
97 -
 98
98 -
 99
99 -
 100
100 -
 101
101 -
 102
102 -
 103
103 -
 104
104 -
 105
105 -
 106
106 -
 107
107 -
 108
108 -
 109
109 -
 110
110 -
111
-
112
-
113
-
114
-
115
-
116
-
117
-
118
-
119
-
120
-
121
-
122
-
123
-
124
-
125
-
126
-
127
-
128
 |
 |

Management utilizes certain estimates and assumptions
to determine the fair value of the subordinated retained
interests, including the interest-only strip. These esti-
mates and assumptions are generally based on projec-
tions of finance charges and fees paid related to the
securitized assets, net credit losses, average loan life, the
contractual fee to service the transferred assets and a dis-
count rate commensurate with the retained interest.
Changes in the estimates and assumptions used may
have a significant impact in the Company’s fair valua-
tion. The key economic assumptions used in measuring
the subordinated retained interests at the time of issu-
ance and during 2004 and 2003 were as follows (rates
are per annum):
2004 2003
Weighted average loan
life (months) 45
Expected credit losses 3.98% – 4.67% 4.60% – 5.52%
Residual cash flows
discounted at 8.3% – 12.0% 8.3% – 12.0%
Returns to investors
Variable Contractual
spread
over LIBOR
ranging from
.04% to .90%
Contractual
spread
over LIBOR
ranging from
.04% to 1.15%
Fixed 1.7% – 7.4% 1.7% – 7.4%
The following table presents quantitative information
about delinquencies, net credit losses and components
of securitized cardmember loans on a trust basis at
December 31:
(Billions)
Total
Principal
Amount
of Loans
Principal
Amount of
Loans 30
Days or
More Past
Due
Net
Credit
Losses
During
the Year
2004
Cardmember loans managed $ 47.2 $ 1.2 $ 2.0
Less: Securitized
cardmember loans sold 20.3 0.6 1.0
Cardmember loans on
balance sheet $ 26.9 $ 0.6 $ 1.0
2003
Cardmember loans managed $ 45.3 $ 1.3 $ 2.2
Less: Securitized
cardmember loans sold
(a)
19.5 0.6 1.0
Cardmember loans on
balance sheet $ 25.8 $ 0.7 $ 1.2
(a) Includes securitized equipment lease receivables of $0.1 billion at
December 31, 2003.
The key economic assumptions and the sensitivity of
the current year’s fair value of the interest-only strip to
immediate 10 percent and 20 percent adverse changes
in assumed economics are as follows:
(Millions, except rates per annum)
Monthly
Payment Rate
Expected
Credit
Losses
Cash Flows from
Interest-only
Strips
Discounted at
Assumption 24.3% 4.0% 12%
Impact on fair value of
10% adverse change $ 14 $ 21 $ 0.5
Impact on fair value of
20% adverse change $ 27 $ 41 $ 1.0
These sensitivities are hypothetical and will be differ-
ent from what actually occurs in the future. Any change
in fair value based on a 10 percent variation in assump-
tions cannot be extrapolated in part because the rela-
tionship of the change in an assumption on the fair
value of the retained interest is calculated independent
from any change in another assumption; in reality,
changes in one factor may result in changes in another,
which magnify or offset the sensitivities.
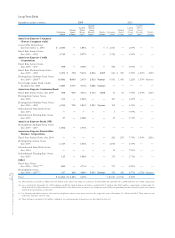
The table below summarizes cash flows received from
all securitization trusts for 2004 and 2003:
(Millions) 2004 2003
Proceeds from new
securitizations during
the period $ 3,888 $ 3,442
Proceeds from collections
reinvested in revolving
cardmember securitizations $ 54,933 $ 45,907
Servicing fees received $ 388 $ 378
Other cash flows received
on retained interests
(a)
$ 1,845 $ 1,713
(a) Represents cash flows from interest-only strips.
During the fourth quarter of 2004, the Company sold
the equipment leasing product line in its small business
financing unit. Prior to the sale, the Company securi-
tized certain of the equipment lease receivables within
that product line. At December 31, 2003, the amounts
sold and outstanding to third-party investors was
$138 million.
AXP
AR.04
98
Notes to Consolidated Financial Statements