American Express 2004 Annual Report Download - page 111
Download and view the complete annual report
Please find page 111 of the 2004 American Express annual report below. You can navigate through the pages in the report by either clicking on the pages listed below, or by using the keyword search tool below to find specific information within the annual report.-
 1
1 -
2
-
3
-
4
-
5
-
6
-
7
-
8
-
9
-
10
-
11
-
12
-
13
-
14
-
15
-
16
-
17
-
18
-
19
-
20
-
21
-
22
-
23
-
24
-
25
-
26
-
27
-
28
-
29
-
30
-
31
-
32
-
33
-
34
-
35
-
36
-
37
-
38
-
39
-
40
-
41
-
42
-
43
-
44
-
45
-
46
-
47
-
48
-
49
-
50
-
51
-
52
-
53
-
54
-
55
-
56
-
57
-
58
-
59
-
60
-
61
-
62
-
63
-
64
-
65
-
66
-
67
-
68
-
69
-
70
-
71
-
72
-
73
-
74
-
75
-
76
-
77
-
78
-
79
-
80
-
81
-
82
-
83
-
84
-
85
-
86
-
87
-
88
-
89
-
90
-
91
-
92
-
93
-
94
-
95
-
96
-
97
-
98
-
99
-
100
-
 101
101 -
 102
102 -
 103
103 -
 104
104 -
 105
105 -
 106
106 -
 107
107 -
 108
108 -
 109
109 -
 110
110 -
 111
111 -
 112
112 -
 113
113 -
 114
114 -
 115
115 -
 116
116 -
 117
117 -
 118
118 -
 119
119 -
 120
120 -
 121
121 -
122
-
123
-
124
-
125
-
126
-
127
-
128
 |
 |

values. Additionally, management believes the value of
excluded assets and liabilities is significant. The fair
value of the Company, therefore, cannot be estimated
by aggregating the amounts presented.
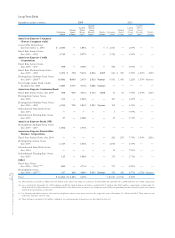
The following table discloses fair value information for
financial instruments:
December 31, (Billions) 2004 2003
Carrying
Value Fair Value
Carrying
Value Fair Value
Financial Assets
Assets for which carrying values
approximate fair value $ 77.9 $ 77.9 $ 69.0 $ 69.0
Investments $ 60.8 $ 61.1 $ 56.6 $ 57.0
Loans $ 34.9 $ 35.0 $ 32.3 $ 32.4
Financial Liabilities
Liabilities for which carrying values
approximate fair value $ 53.8 $ 53.8 $ 58.0 $ 58.0
Fixed annuity reserves $ 25.5 $ 24.8 $ 24.9 $ 24.1
Investment certificate reserves $ 11.3 $ 11.3 $ 9.2 $ 9.2
Long-term debt $ 33.1 $ 32.8 $ 20.7 $ 20.9
Separate account liabilities $ 31.7 $ 30.6 $ 27.3 $ 26.4
See Note 2 for carrying and fair value information
regarding investments and see Note 10 for carrying and
fair value information regarding guarantees and certain
off-balance sheet items. The following methods were
used to estimate the fair values of financial assets and
financial liabilities.
Financial Assets
Assets for which carrying values approximate fair values
include cash and cash equivalents, accounts receivable
and accrued interest, separate account assets, certain
other assets and derivative financial instruments.
Generally these assets are either short-term in dura-
tion or are recorded at fair value on the Consolidated
Balance Sheets.
Generally, investments are carried at fair value on
the Consolidated Balance Sheets and gains and losses
are recognized in the Consolidated Statements of
Income upon disposition of the securities or when
management determines that a decline in value is
other-than-temporary.
For variable-rate loans that reprice within one year and
for which there has been no significant change in coun-
terparties’ creditworthiness, fair values approximate
carrying values.
The fair values of all other loans (including investment
loans), except those with significant credit deteriora-
tion, are estimated using discounted cash flow analysis,
based on current interest rates for loans with similar
terms to borrowers of similar credit quality. For loans
with significant credit deterioration, fair values are
based on estimates of future cash flows discounted at
rates commensurate with the risk inherent in the
revised cash flow projections, or for collateral depen-
dent loans on collateral values.
Financial Liabilities
Liabilities for which carrying values approximate fair
values include customers’ deposits, Travelers Cheques
outstanding, accounts payable, short-term debt, certain
other liabilities and derivative financial instruments.
Generally these liabilities are either short-term in dura-
tion or are recorded at fair value on the Consolidated
Balance Sheets.
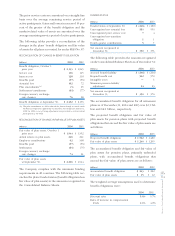
The fair values of fixed annuity reserves in deferral sta-
tus are estimated as the accumulated value less appli-
cable surrender charges and loans. For annuities in
payout status, fair value is estimated using discounted
cash flows, based on current interest rates. The carrying
value and fair value of these reserves in the table
above exclude life insurance related elements of
$1.5 billion and $1.4 billion at December 31, 2004 and
2003, respectively.
For variable-rate investment certificates that reprice
within one year, fair value of the related reserves
approximates carrying value. For other investment cer-
tificate reserves, fair value is estimated using dis-
counted cash flows based on current interest rates. The
valuations are reduced by the amount of applicable
surrender charges and related loans.
For variable-rate long-term debt that reprices within
one year, fair value approximates carrying value. For
other long-term debt, fair value is estimated using
either quoted market prices or discounted cash flows
AXP
AR.04
109
Notes to Consolidated Financial Statements