American Express 2004 Annual Report Download - page 53
Download and view the complete annual report
Please find page 53 of the 2004 American Express annual report below. You can navigate through the pages in the report by either clicking on the pages listed below, or by using the keyword search tool below to find specific information within the annual report.-
 1
1 -
2
-
3
-
4
-
5
-
6
-
7
-
8
-
9
-
10
-
11
-
12
-
13
-
14
-
15
-
16
-
17
-
18
-
19
-
20
-
21
-
22
-
23
-
24
-
25
-
26
-
27
-
28
-
29
-
30
-
31
-
32
-
33
-
34
-
35
-
36
-
37
-
38
-
39
-
40
-
41
-
42
-
 43
43 -
 44
44 -
 45
45 -
 46
46 -
 47
47 -
 48
48 -
 49
49 -
 50
50 -
 51
51 -
 52
52 -
 53
53 -
 54
54 -
 55
55 -
 56
56 -
 57
57 -
 58
58 -
 59
59 -
 60
60 -
 61
61 -
 62
62 -
 63
63 -
64
-
65
-
66
-
67
-
68
-
69
-
70
-
71
-
72
-
73
-
74
-
75
-
76
-
77
-
78
-
79
-
80
-
81
-
82
-
83
-
84
-
85
-
86
-
87
-
88
-
89
-
90
-
91
-
92
-
93
-
94
-
95
-
96
-
97
-
98
-
99
-
100
-
101
-
102
-
103
-
104
-
105
-
106
-
107
-
108
-
109
-
110
-
111
-
112
-
113
-
114
-
115
-
116
-
117
-
118
-
119
-
120
-
121
-
122
-
123
-
124
-
125
-
126
-
127
-
128
 |
 |

primarily due to merit increases and higher employee
benefit and management incentive costs, partially offset
by the benefits of reengineering efforts.
Total other operating expenses of $5.3 billion increased
6 percent during 2004 primarily due to increases in pro-
fessional fees and occupancy and equipment expenses,
partially offset by the $117 million net gain in connec-
tion with the sale of the equipment leasing product line
noted earlier. The increase in professional fees primarily
reflects the impact of higher business volume-related
technology outsourcing costs. Occupancy and equip-
ment expenses increased primarily due to outsourced
data processing services and increased depreciation of
data processing equipment as well as the impact of the
fourth quarter restructuring charges noted earlier. In
2003, total other operating expenses rose 8 percent to
$4.9 billion due to the impact of greater business and
service volume-related costs, including outsourcing
activities, partially offset by the benefits of reengineer-
ing initiatives and other cost containment efforts.
The effective tax rate was 31 percent in 2004 versus 32
percent in 2003. The effective tax rate was lower in 2004
as compared to 2003 primarily as a result of one-time and
ongoing benefits related to the changes in international
funding strategy during 2004, favorable variances
between estimates of foreign tax expense and returns
actually filed and favorable tax audit experience. The
shifts in international funding strategy, which diversify
funding sources and increase liquidity, are expected also
to benefit TRS’ effective tax rate and net income in future
periods despite somewhat higher related funding costs.
Airline Industry Matters
Historically, the Company has not experienced signifi-
cant revenue declines resulting from a particular air-
line’s scaling-back or closure of operations due to
bankruptcy or other financial challenges because the
volumes generated from the airline are typically shifted
to other participants in the industry that accept the Com-
pany’s card products. Nonetheless, the Company is
exposed to business and credit risk in the airline indus-
try primarily through business arrangements where the
Company has remitted payment to the airline for a card-
member purchase of tickets that have not yet been used
or “flown”. This creates a potential exposure for the
Company in the event that the cardmember is not able
to use the ticket and the Company, based on the facts
and circumstances, credits the cardmember for the
unused ticket. Historically, this type of exposure has not
generated any significant losses for the Company
because of the need for an airline that is operating under
bankruptcy protection to continue accepting credit and
charge cards and honoring requests for credits and
refunds in the ordinary course in furtherance of its reor-
ganization and its formal assumption, with bankruptcy
court approval, of its card acceptance agreement,
including approval of the Company’s right to hold cash
to cover these potential exposures to provide credits to
cardmembers. Typically, as an airline’s financial situa-
tion deteriorates the Company increases cash held to
protect itself in the event of an ultimate liquidation of
the airline. The Company’s goal in these distressed situ-
ations is to hold sufficient cash over time to ensure that
upon liquidation the cash held is equivalent to the credit
exposure related to any unused tickets.
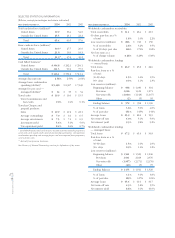
Liquidity and Capital Resources
SELECTED BALANCE SHEET INFORMATION (GAAP BASIS)
December 31, (Billions, except percentages) 2004 2003
Accounts receivable, net $ 31.8 $ 30.2
Travelers Cheque investments $ 8.4 $ 7.7
Cardmember loans $ 26.9 $ 25.8
Total assets $ 87.8 $ 79.3
Travelers Cheques outstanding $ 7.3 $ 6.8
Short-term debt $ 17.2 $ 21.8
Long-term debt $ 28.3 $ 16.6
Total liabilities $ 79.0 $ 71.4
Total shareholder’s equity $ 8.8 $ 7.9
Return on average total
shareholder’s equity 33.4% 31.3%
Return on average total assets 3.5% 3.4%
See Glossary of Selected Terminology section for definitions of key terms.
Net accounts receivable and worldwide cardmember
loans increased as compared to December 31, 2003, pri-
marily as a result of higher average cardmember spend-
ing and an increase in the number of cards-in-force.
Total debt increased compared to December 31, 2003
primarily as a result of increased funding requirements
due to the noted increases in cardmember receivable
and loan balances as well as the contingent liquidity
program discussed below. New long-term borrowing
activity during 2004 is described below.
Financing Activities
TRS funds its cardmember receivables and loans using
various funding sources, such as short- and long-term
debt, medium-term notes, and sales of cardmember
receivables and loans in securitizations. In 2004 and
2003, TRS had uninterrupted access to the money and
capital markets to fund its business operations.
TRS funds its receivables and loans primarily through
five entities. Credco finances the vast majority of card-
member receivables, while Centurion Bank and FSB
AXP
AR.04
51
Financial Review