American Express 2004 Annual Report Download - page 49
Download and view the complete annual report
Please find page 49 of the 2004 American Express annual report below. You can navigate through the pages in the report by either clicking on the pages listed below, or by using the keyword search tool below to find specific information within the annual report.-
 1
1 -
2
-
3
-
4
-
5
-
6
-
7
-
8
-
9
-
10
-
11
-
12
-
13
-
14
-
15
-
16
-
17
-
18
-
19
-
20
-
21
-
22
-
23
-
24
-
25
-
26
-
27
-
28
-
29
-
30
-
31
-
32
-
33
-
34
-
35
-
36
-
37
-
38
-
 39
39 -
 40
40 -
 41
41 -
 42
42 -
 43
43 -
 44
44 -
 45
45 -
 46
46 -
 47
47 -
 48
48 -
 49
49 -
 50
50 -
 51
51 -
 52
52 -
 53
53 -
 54
54 -
 55
55 -
 56
56 -
 57
57 -
 58
58 -
 59
59 -
60
-
61
-
62
-
63
-
64
-
65
-
66
-
67
-
68
-
69
-
70
-
71
-
72
-
73
-
74
-
75
-
76
-
77
-
78
-
79
-
80
-
81
-
82
-
83
-
84
-
85
-
86
-
87
-
88
-
89
-
90
-
91
-
92
-
93
-
94
-
95
-
96
-
97
-
98
-
99
-
100
-
101
-
102
-
103
-
104
-
105
-
106
-
107
-
108
-
109
-
110
-
111
-
112
-
113
-
114
-
115
-
116
-
117
-
118
-
119
-
120
-
121
-
122
-
123
-
124
-
125
-
126
-
127
-
128
 |
 |

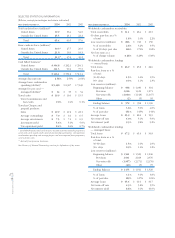
GAAP Basis to Managed Basis Reconciliation — Effect of Securitizations
Years Ended December 31, (Millions)
GAAP Basis
2004 2003 2002
Net revenues:
Discount revenue $ 10,249 $ 8,781 $ 7,931
Lending:
Finance charge revenue 2,795 2,525 2,338
Interest expense 571 483 510
Net finance
charge revenue 2,224 2,042 1,828
Net card fees 1,909 1,835 1,726
Travel commissions
and fees 1,795 1,507 1,408
Other commissions
and fees 2,230 1,901 1,833
Travelers Cheque
investment income 378 367 375
Securitization income, net 1,132 1,105 1,049
Other 1,661 1,651 1,571
Total net revenues 21,578 19,189 17,721
Expenses:
Marketing, promotion,
rewards and
cardmember services 4,944 3,814 3,027
Provision for losses
and claims:
Charge card 833 853 960
Lending 1,130 1,218 1,369
Other 176 127 149
Total 2,139 2,198 2,478
Charge card
interest expense 713 786 1,001
Human resources 4,389 3,822 3,503
Other operating
expenses:
Professional services 2,101 1,958 1,693
Occupancy and
equipment 1,300 1,199 1,102
Communications 465 452 443
Other 1,410 1,389 1,394
Total other
operating expenses 5,276 4,998 4,632
Total expenses 17,461 15,618 14,641
Pretax income 4,117 3,571 3,080
Income tax provision 1,265 1,141 945
Net income $ 2,852 $ 2,430 $ 2,135
See Glossary of Selected Terminology section for definitions of key terms.
Effect of Securitizations
Securitization Effect Managed Basis
2004 2003 2002 2004 2003 2002
$ 2,222 $ 2,172 $ 2,166 $ 5,017 $ 4,697 $ 4,504
384 317 340 955 800 850
1,838 1,855 1,826 4,062 3,897 3,654
210 193 185 2,440 2,094 2,018
(1,132) (1,105) (1,049) ———
—— (14) 1,661 1,651 1,557
916 943 948 22,494 20,132 18,669
(16) (74) (81) 4,928 3,740 2,946
942 1,067 1,098 2,072 2,285 2,467
942 1,067 1,098 3,081 3,265 3,576
—— (14) 713 786 987
(10) (50) (55) 1,400 1,339 1,339
(10) (50) (55) 5,266 4,948 4,577
$ 916 $ 943 $ 948 $ 18,377 $ 16,561 $15,589
AXP
AR.04
47
Financial Review