American Express 2004 Annual Report Download - page 122
Download and view the complete annual report
Please find page 122 of the 2004 American Express annual report below. You can navigate through the pages in the report by either clicking on the pages listed below, or by using the keyword search tool below to find specific information within the annual report.-
 1
1 -
2
-
3
-
4
-
5
-
6
-
7
-
8
-
9
-
10
-
11
-
12
-
13
-
14
-
15
-
16
-
17
-
18
-
19
-
20
-
21
-
22
-
23
-
24
-
25
-
26
-
27
-
28
-
29
-
30
-
31
-
32
-
33
-
34
-
35
-
36
-
37
-
38
-
39
-
40
-
41
-
42
-
43
-
44
-
45
-
46
-
47
-
48
-
49
-
50
-
51
-
52
-
53
-
54
-
55
-
56
-
57
-
58
-
59
-
60
-
61
-
62
-
63
-
64
-
65
-
66
-
67
-
68
-
69
-
70
-
71
-
72
-
73
-
74
-
75
-
76
-
77
-
78
-
79
-
80
-
81
-
82
-
83
-
84
-
85
-
86
-
87
-
88
-
89
-
90
-
91
-
92
-
93
-
94
-
95
-
96
-
97
-
98
-
99
-
100
-
101
-
102
-
103
-
104
-
105
-
106
-
107
-
108
-
109
-
110
-
111
-
 112
112 -
 113
113 -
 114
114 -
 115
115 -
 116
116 -
 117
117 -
 118
118 -
 119
119 -
 120
120 -
 121
121 -
 122
122 -
 123
123 -
 124
124 -
 125
125 -
 126
126 -
 127
127 -
 128
128
 |
 |

Geographic Operations
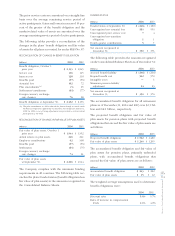
The following table presents the Company’s revenues and pretax income in different geographic regions:
(Millions) United States Europe Asia/Pacific All Other
Adjustments
and
Eliminations Consolidated
2004
Revenues $ 22,918 $ 3,137 $ 2,309 $ 2,067 $ (1,316) $ 29,115
Pretax income before accounting change
(a)
$ 3,980 $ 373 $ 285 $ 313 $ — $ 4,951
2003
Revenues $ 20,859 $ 2,273 $ 1,992 $ 1,852 $ (1,140) $ 25,836
Pretax income before accounting change
(b)
$ 3,385 $ 396 $ 216 $ 250 $ — $ 4,247
2002
Revenues $ 19,286 $ 1,943 $ 1,685 $ 1,586 $ (693) $ 23,807
Pretax income $ 2,983 $ 310 $ 181 $ 253 $ — $ 3,727
(a) 2004 results reflect a $109 million non-cash pretax charge ($71 million after-tax) related to the January 1, 2004 adoption of SOP 03-1. In addition, 2004
results reflect aggregate restructuring charges of $102 million ($66 million after-tax).
(b) 2003 results reflect a $20 million non-cash pretax charge ($13 million after-tax) related to the December 31, 2003 adoption of FIN 46, as revised.
Net foreign currency transaction losses amounted to
$186 million, $183 million and $77 million in 2004, 2003
and 2002, respectively.
Most services of the Company are provided on an inte-
grated worldwide basis. Therefore, it is not practicable
to separate precisely the U.S. and international ser-
vices. Accordingly, the data in the above table are, in
part, based upon internal allocations, which necessar-
ily involve management’s judgment.
Note 20 TRANSFER OF FUNDS FROM
SUBSIDIARIES
Restrictions on the transfer of funds exist under debt
agreements and regulatory requirements of certain of
the Company’s subsidiaries. These restrictions have not
had any effect on the Company’s shareholder dividend
policy and management does not anticipate any effect
in the future.
At December 31, 2004, the aggregate amount of net
assets of subsidiaries that may be transferred to the Par-
ent Company was approximately $11 billion. Should
specific additional needs arise, procedures exist to per-
mit immediate transfer of short-term funds between the
Company and its subsidiaries, while complying with
the various contractual and regulatory constraints on
the internal transfer of funds.
AXP
AR.04
120
Notes to Consolidated Financial Statements