American Express 2004 Annual Report Download - page 60
Download and view the complete annual report
Please find page 60 of the 2004 American Express annual report below. You can navigate through the pages in the report by either clicking on the pages listed below, or by using the keyword search tool below to find specific information within the annual report.-
 1
1 -
2
-
3
-
4
-
5
-
6
-
7
-
8
-
9
-
10
-
11
-
12
-
13
-
14
-
15
-
16
-
17
-
18
-
19
-
20
-
21
-
22
-
23
-
24
-
25
-
26
-
27
-
28
-
29
-
30
-
31
-
32
-
33
-
34
-
35
-
36
-
37
-
38
-
39
-
40
-
41
-
42
-
43
-
44
-
45
-
46
-
47
-
48
-
49
-
 50
50 -
 51
51 -
 52
52 -
 53
53 -
 54
54 -
 55
55 -
 56
56 -
 57
57 -
 58
58 -
 59
59 -
 60
60 -
 61
61 -
 62
62 -
 63
63 -
 64
64 -
 65
65 -
 66
66 -
 67
67 -
 68
68 -
 69
69 -
 70
70 -
71
-
72
-
73
-
74
-
75
-
76
-
77
-
78
-
79
-
80
-
81
-
82
-
83
-
84
-
85
-
86
-
87
-
88
-
89
-
90
-
91
-
92
-
93
-
94
-
95
-
96
-
97
-
98
-
99
-
100
-
101
-
102
-
103
-
104
-
105
-
106
-
107
-
108
-
109
-
110
-
111
-
112
-
113
-
114
-
115
-
116
-
117
-
118
-
119
-
120
-
121
-
122
-
123
-
124
-
125
-
126
-
127
-
128
 |
 |

AEFA’s 2004 income before accounting change rose 18
percent to $806 million, up from $682 million in 2003.
AEFA’s net income increased 10 percent to $735 million
in 2004, up from $669 million in 2003 and $632 million
in 2002. AEFA’s 2004 results reflect the $71 million
($109 million pretax) impact of the January 1, 2004
adoption of SOP 03-1. SOP 03-1 requires insurance
enterprises to establish liabilities for benefits that may
become payable under variable annuity death benefit
guarantees or other insurance and annuity contract
provisions. Results for 2003 reflect the impact of the
December 31, 2003 adoption of FIN 46, as revised,
which addresses consolidation by business enterprises
of VIEs and is discussed in more detail below.
Revenues
Total revenues increased 15 percent in 2004 to $7.0 bil-
lion primarily due to significantly higher investment
management and service fees, greater distribution fees,
larger net investment income, greater property-
casualty insurance premiums and higher other rev-
enues. In addition, the acquisition of Threadneedle on
September 30, 2003 contributed approximately 5 per-
cent to the revenue growth and a modest contribution
to net income growth. Total revenues rose 10 percent
in 2003 to $6.1 billion due to higher net investment
income, increased distribution fees and larger
property-casualty insurance premiums.
Net investment income increased 4 percent to $2.4 bil-
lion in 2004 primarily due to the benefits of higher lev-
els of invested assets and net investment gains in 2004
compared to net investment losses in 2003. During
2003, net investment income increased reflecting
higher levels of invested assets and the effect of appre-
ciation in the S&P 500 on the value of options hedging
outstanding stock market certificates and equity
indexed annuities versus market depreciation in the
previous year, which was offset in the related provi-
sions for losses and benefits. These increases were par-
tially offset by a lower average yield.
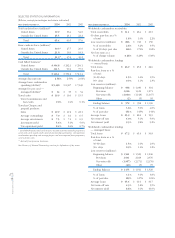
Realized gains and losses are recorded in net invest-
ment income and are summarized in the following
table. For 2004, the total investment gains include $25
million in benefits reflecting lower than expected
losses resulting from management’s first quarter 2004
decision to liquidate a secured loan trust (SLT) man-
aged by AEFA. Total investment losses during 2004
include $53 million of charges related to three SLT
liquidations (including the original first quarter $49
million charge).
Years Ended December 31, (Millions) 2004 2003 2002
Gross investment gains:
Available-for-Sale securities $68 $ 323 $ 342
SLT liquidation
(a)
25 ——
Structured investments
(b)
—18 17
Other 722
Total $100 $ 343 $ 361
Gross investment losses:
Available-for-Sale securities $ (22) $(146) $(168)
SLT liquidation
(a)
(53) ——
Commercial mortgages (10) (20) (26)
Structured investments
(b)
(2) (34) (40)
Other —— (2)
Total $ (87) $(200) $(236)
Other-than-temporary
impairments:
Available-for-Sale securities $ (2) $(163) $(204)
Total $ (2) $(163) $(204)
(a) Relates to SLTs consolidated in accordance with FIN 46.
(b) Includes yield adjustments reflected in net investment income resulting
from changes in cash flow estimates and the application of EITF 96-12,
“Recognition of Interest Income and Balance Sheet Classification of
Structured Notes.”
Investment management and service fees increased 30
percent to $1.7 billion. Approximately 75 percent of the
increase was due to the full-year impact of Thread-
needle with the remaining increase primarily attributed
to strengthening equity markets and net asset inflows.
In 2003, investment management and services fees rose
2 percent due to higher average assets under manage-
ment reflecting the Threadneedle acquisition.
Distribution fees increased 19 percent to $1.3 billion
primarily due to greater mutual fund fees driven prin-
cipally by fees earned on wrap account assets as well
as increased retail and institutional brokerage fees. The
asset values of wrap accounts were up 52 percent
versus 2003 . In 2003, distribution fees increased 12 per-
cent as a result of greater limited partnership product
sales and an increase in brokerage-related activities.
Property-casualty insurance premiums rose signifi-
cantly in 2004 and 2003 to $422 million and $326 mil-
lion, respectively, driven primarily by an increase in the
average number of policies inforce, primarily automo-
bile insurance sold through the Costco relationship.
Expenses
Total provision for losses and benefits increased
slightly to $2.1 billion from 2003 levels, which
increased 9 percent from 2002. Interest credited on
annuities and universal life type contracts decreased 8
percent to $1.1 billion due to lower interest crediting
rates, partially offset by higher average inforce levels.
AXP
AR.04
58
Financial Review