American Express 2004 Annual Report Download - page 47
Download and view the complete annual report
Please find page 47 of the 2004 American Express annual report below. You can navigate through the pages in the report by either clicking on the pages listed below, or by using the keyword search tool below to find specific information within the annual report.-
 1
1 -
2
-
3
-
4
-
5
-
6
-
7
-
8
-
9
-
10
-
11
-
12
-
13
-
14
-
15
-
16
-
17
-
18
-
19
-
20
-
21
-
22
-
23
-
24
-
25
-
26
-
27
-
28
-
29
-
30
-
31
-
32
-
33
-
34
-
35
-
36
-
 37
37 -
 38
38 -
 39
39 -
 40
40 -
 41
41 -
 42
42 -
 43
43 -
 44
44 -
 45
45 -
 46
46 -
 47
47 -
 48
48 -
 49
49 -
 50
50 -
 51
51 -
 52
52 -
 53
53 -
 54
54 -
 55
55 -
 56
56 -
 57
57 -
58
-
59
-
60
-
61
-
62
-
63
-
64
-
65
-
66
-
67
-
68
-
69
-
70
-
71
-
72
-
73
-
74
-
75
-
76
-
77
-
78
-
79
-
80
-
81
-
82
-
83
-
84
-
85
-
86
-
87
-
88
-
89
-
90
-
91
-
92
-
93
-
94
-
95
-
96
-
97
-
98
-
99
-
100
-
101
-
102
-
103
-
104
-
105
-
106
-
107
-
108
-
109
-
110
-
111
-
112
-
113
-
114
-
115
-
116
-
117
-
118
-
119
-
120
-
121
-
122
-
123
-
124
-
125
-
126
-
127
-
128
 |
 |

TRAVEL RELATED SERVICES
Results of Operations
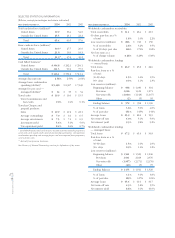
STATEMENTS OF INCOME
Years Ended December 31, (Millions) 2004 2003 2002
Net revenues:
Discount revenue $ 10,249 $ 8,781 $ 7,931
Lending:
Finance charge revenue 2,795 2,525 2,338
Interest expense 571 483 510
Net finance charge
revenue 2,224 2,042 1,828
Net card fees 1,909 1,835 1,726
Travel commissions
and fees 1,795 1,507 1,408
Other commissions
and fees 2,230 1,901 1,833
Travelers Cheque
investment income 378 367 375
Securitization income, net 1,132 1,105 1,049
Other 1,661 1,651 1,571
Total net revenues 21,578 19,189 17,721
Expenses:
Marketing, promotion,
rewards and
cardmember services 4,944 3,814 3,027
Provision for losses
and claims:
Charge card 833 853 960
Lending 1,130 1,218 1,369
Other 176 127 149
Total 2,139 2,198 2,478
Charge card interest
expense 713 786 1,001
Human resources 4,389 3,822 3,503
Other operating expenses:
Professional services 2,101 1,958 1,693
Occupancy and
equipment 1,300 1,199 1,102
Communications 465 452 443
Other 1,410 1,389 1,394
Total other operating
expenses 5,276 4,998 4,632
Total expenses 17,461 15,618 14,641
Pretax income 4,117 3,571 3,080
Income tax provision 1,265 1,141 945
Net income $ 2,852 $ 2,430 $ 2,135
See Glossary of Selected Terminology section for definitions of key terms.
TRS reported net income of $2.9 billion in 2004, a 17
percent increase from $2.4 billion in 2003, which
increased 14 percent from 2002.
The quality of TRS’ card customer base, the breadth of
its product portfolio, the benefits of its reward-based,
spend oriented business model and its improved
revolving credit capabilities combined to create a com-
petitive advantage that was leveraged effectively to
deliver strong TRS results. The Company’s continued
investments in growth initiatives over the past several
years have resulted in strong growth in cardmember
spending in the retail and everyday spending catego-
ries and continued improvement in the travel and
entertainment sector, significant increases in cards-in-
force from expansion of both proprietary and network
card businesses, and quality lending balance growth.
See Executive Overview for a general discussion of
TRS’ businesses and operations.
TRS’ owned portfolio is primarily comprised of card-
member receivables generated by the Company’s
charge card products, unsecuritized U.S. cardmember
loans and international cardmember loans.
As discussed more fully in the TRS Liquidity and Capital
Resources section below, the Company securitizes
U.S. cardmember loans as part of its financing strat-
egy; consequently, the level of unsecuritized U.S.
cardmember loans is primarily a function of the
Company’s financing requirements. As a portfolio,
unsecuritized U.S. cardmember loans tend to be less
seasoned than securitized loans, primarily because of
the lead time required to designate and securitize
each loan. The Company does not currently securitize
international loans. Delinquency, reserve coverage
and net write-off rates have historically been broadly
comparable between the Company’s owned and man-
aged portfolios.
The following management discussion includes infor-
mation on both a GAAP basis and managed basis. The
Company presents TRS information on a managed
basis because that is the way the Company’s manage-
ment views and manages the business. It differs from
the accompanying financial statements, which are pre-
pared in accordance with GAAP, as managed basis pre-
sentation assumes there have been no securitization
transactions, i.e., as if all securitized cardmember loans
and related income effects are reflected in the Compa-
ny’s balance sheet and income statement, respectively.
Management believes that the trends in the Company’s
cardmember lending business are more accurately por-
trayed by evaluating the performance of both securi-
tized and non-securitized cardmember loans. Asset
securitization is just one of several ways the Company
funds cardmember loans. Use of a managed basis pre-
sentation, including non-securitized and securitized
cardmember loans, presents a more accurate picture of
the key dynamics of the cardmember lending business,
avoiding distortions due to the mix of funding sources
AXP
AR.04
45
Financial Review