American Express 2004 Annual Report Download - page 40
Download and view the complete annual report
Please find page 40 of the 2004 American Express annual report below. You can navigate through the pages in the report by either clicking on the pages listed below, or by using the keyword search tool below to find specific information within the annual report.-
 1
1 -
2
-
3
-
4
-
5
-
6
-
7
-
8
-
9
-
10
-
11
-
12
-
13
-
14
-
15
-
16
-
17
-
18
-
19
-
20
-
21
-
22
-
23
-
24
-
25
-
26
-
27
-
28
-
29
-
 30
30 -
 31
31 -
 32
32 -
 33
33 -
 34
34 -
 35
35 -
 36
36 -
 37
37 -
 38
38 -
 39
39 -
 40
40 -
 41
41 -
 42
42 -
 43
43 -
 44
44 -
 45
45 -
 46
46 -
 47
47 -
 48
48 -
 49
49 -
 50
50 -
51
-
52
-
53
-
54
-
55
-
56
-
57
-
58
-
59
-
60
-
61
-
62
-
63
-
64
-
65
-
66
-
67
-
68
-
69
-
70
-
71
-
72
-
73
-
74
-
75
-
76
-
77
-
78
-
79
-
80
-
81
-
82
-
83
-
84
-
85
-
86
-
87
-
88
-
89
-
90
-
91
-
92
-
93
-
94
-
95
-
96
-
97
-
98
-
99
-
100
-
101
-
102
-
103
-
104
-
105
-
106
-
107
-
108
-
109
-
110
-
111
-
112
-
113
-
114
-
115
-
116
-
117
-
118
-
119
-
120
-
121
-
122
-
123
-
124
-
125
-
126
-
127
-
128
 |
 |

help ensure the availability of financing in unexpected
periods of stress, and to be concurrently integrated into
the asset-liability management of interest rate exposures.
Liquidity refers to the Company’s ability to meet its cur-
rent and future cash needs. In addition to its funding plan
described below, the Company’s contingent funding
strategy is designed to allow for the continued funding
of business operations through difficult economic, finan-
cial market and business conditions when access to its
regular funding sources could become diminished
or interrupted.
TRS is the primary asset generating business with sig-
nificant assets in both domestic and international card-
member receivable and lending activities. As such, the
Company’s most significant borrowing and liquidity
needs are associated with TRS’ card businesses. TRS
pays merchants for card transactions and bills card-
members accordingly. TRS funds merchant payments
during the period cardmember loans and receivables
are outstanding. AEFA’s borrowing needs are less sig-
nificant as it generates funds through its operations, pri-
marily by the sale of insurance, annuity or certificate
products. AEB also has limited borrowing needs as its
principal funding source is customer deposits. See the
Liquidity and Capital Resources section for TRS, AEFA
and AEB for further discussion regarding each operat-
ing segment’s funding activities and liquidity manage-
ment practices.
The following discussion includes information on both
a GAAP and managed basis. The managed basis presen-
tation includes debt issued in connection with the
Company’s lending securitization activities, which are
off-balance sheet. The Company’s management views
and manages funding requirements on a managed basis
because asset securitization is just one of several ways
for the Company to fund cardmember loans. Use of a
managed basis presentation, including both on- and off-
balance sheet debt, avoids distortions due to the mix of
funding sources at any particular point in time.
Funding Strategy
The Company’s funding sources are well-diversified
and include commercial paper, retail and institutional
customer deposits, bank notes, medium-term notes,
senior debt, asset securitizations and other borrowed
funds. Diversity of funding sources by debt instrument
and by investor base provides additional insulation
from unforeseen events in the short-term debt market.
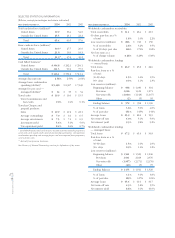
The Company had the following consolidated debt, on
both a GAAP and managed basis, and customer depos-
its outstanding at December 31, 2004 and 2003:
December 31, (Billions) 2004 2003
Short-term debt $ 14.2 $ 19.0
Long-term debt 33.0 20.7
Total debt (GAAP basis) $ 47.2 $ 39.7
Off-balance sheet securitizations
(a)
20.3 19.5
Total debt (managed basis) $ 67.5 $ 59.2
Customer deposits $ 21.1 $ 21.3
(a) Includes securitized equipment leasing receivables of $0.1 billion at
December 31, 2003.
In addition to deposits and debt, the Company uses off-
balance sheet arrangements, principally through the
sales of consumer cardmember loans in securitizations.
In 2004, the Company securitized $3.9 billion in loans
from its consumer loans portfolio while $3.0 billion
of investor interests matured. As of December 31, 2004
and 2003, the Company, through a lending securitiza-
tion trust, held total assets of $24.7 billion and $26.8
billion, respectively, of which $20.3 billion and $19.4
billion, respectively, had been sold.
Additionally, the Company had securitized cardmem-
ber receivables of $7.4 billion at December 31, 2004
of which $1.9 billion had been sold. All securitized
cardmember receivables remain on the Consolidated
Balance Sheet.
In 2004, the Company continued to reduce its reliance
on short-term debt. Term debt offerings of $15.2 billion
in 2004 were issued to refinance maturing long-term
obligations, fund business growth and decrease short-
term debt obligations.
December 31, ($ in billions) 2004 2003
Short-term debt $14.2 $19.0
Short-term debt percentage
of total debt (GAAP basis) 30.0% 48.0%
Short-term debt percentage
of total debt (managed basis) 21.0% 32.2%
In 2004, medium- and long-term debt with maturities
ranging from 2 to 5 years was issued. The Company’s
2004 term offerings, which include those made by the
Parent Company; American Express Credit Corpora-
tion (Credco), American Express Centurion Bank (Cen-
turion Bank), and American Express Bank, FSB (FSB),
all wholly-owned subsidiaries of TRS; and the Ameri-
can Express Credit Account Master Trust, are presented
in the following table on a managed basis:
AXP
AR.04
38
Financial Review