American Express 2004 Annual Report Download - page 112
Download and view the complete annual report
Please find page 112 of the 2004 American Express annual report below. You can navigate through the pages in the report by either clicking on the pages listed below, or by using the keyword search tool below to find specific information within the annual report.-
 1
1 -
2
-
3
-
4
-
5
-
6
-
7
-
8
-
9
-
10
-
11
-
12
-
13
-
14
-
15
-
16
-
17
-
18
-
19
-
20
-
21
-
22
-
23
-
24
-
25
-
26
-
27
-
28
-
29
-
30
-
31
-
32
-
33
-
34
-
35
-
36
-
37
-
38
-
39
-
40
-
41
-
42
-
43
-
44
-
45
-
46
-
47
-
48
-
49
-
50
-
51
-
52
-
53
-
54
-
55
-
56
-
57
-
58
-
59
-
60
-
61
-
62
-
63
-
64
-
65
-
66
-
67
-
68
-
69
-
70
-
71
-
72
-
73
-
74
-
75
-
76
-
77
-
78
-
79
-
80
-
81
-
82
-
83
-
84
-
85
-
86
-
87
-
88
-
89
-
90
-
91
-
92
-
93
-
94
-
95
-
96
-
97
-
98
-
99
-
100
-
101
-
 102
102 -
 103
103 -
 104
104 -
 105
105 -
 106
106 -
 107
107 -
 108
108 -
 109
109 -
 110
110 -
 111
111 -
 112
112 -
 113
113 -
 114
114 -
 115
115 -
 116
116 -
 117
117 -
 118
118 -
 119
119 -
 120
120 -
 121
121 -
 122
122 -
123
-
124
-
125
-
126
-
127
-
128
 |
 |

based on the Company’s current borrowing rates for
similar types of borrowing.
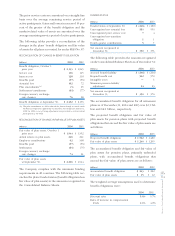
The fair value of separate account liabilities, after
excluding life insurance-related elements of $4.2 bil-
lion and $3.5 billion in 2004 and 2003, respectively, are
estimated as the accumulated value less applicable
surrender charges.
Note 14 SIGNIFICANT CREDIT CONCENTRATIONS
A credit concentration may exist if customers are
involved in similar industries, economic sectors and
geographic regions. The Company’s customers operate
in diverse economic sectors and geographic regions.
Therefore, management does not expect any material
adverse consequences to the Company’s financial posi-
tion to result from these types of credit concentrations.
Certain distinctions between categories require
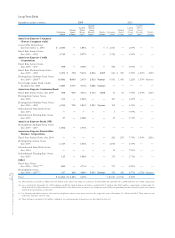
management judgment. The following table represents
the Company’s maximum credit exposure by industry,
including the credit exposure associated with deriva-
tive financial instruments, at December 31:
(Billions, except percentages) 2004 2003
Financial institutions
(a)
$ 28.2 $ 21.2
Individuals, including
cardmember receivables
and loans
(b)
241.9 216.4
U.S. Government and
agencies
(c)
25.7 24.0
All other 26.8 28.2
Total $ 322.6 $ 289.8
Composition:
On-balance sheet 45% 46%
Off-balance sheet 55 54
Total 100% 100%
(a) Financial institutions primarily include banks, broker-dealers, insurance
companies and savings and loan associations.
(b) Charge card products have no preset spending limit; therefore, the quan-
tified credit amount includes only cardmember receivables recorded on the
Consolidated Balance Sheets. For cardmember loans, the quantified credit
amount includes the total credit line available to cardmembers.
(c) U.S. Government and agencies represent the U.S. Government and its agen-
cies, states and municipalities, and quasi-government agencies.
Exposure to Airline Industry
Historically, the Company has not experienced signifi-
cant revenue declines resulting from a particular air-
line’s scaling-back of operations due to bankruptcy or
other financial challenges because the volumes gener-
ated from the airline are typically shifted to other par-
ticipants in the industry that accept the Company’s card
products. Nonetheless, the Company is exposed to
business and credit risk in the airline industry primarily
through business arrangements where the Company
has remitted payment to the airline for a cardmember
purchase of tickets that have not yet been used or
“flown”. This creates a potential exposure for the Com-
pany in the event that the cardmember is not able to use
the ticket and the Company, based on the facts and cir-
cumstances, credits the cardmember for the unused
ticket. Historically, this type of exposure has not gen-
erated any significant losses for the Company because
of the need for an airline that is operating under bank-
ruptcy protection to continue accepting credit and
charge cards and honoring requests for credits and
refunds in the ordinary course in furtherance of its reor-
ganization and its formal assumption, with bankruptcy
court approval, of its card acceptance agreement,
including approval of the Company’s right to hold cash
when necessary. The Company’s current airline mer-
chant agreements generally allow the Company to hold
cash to cover these potential exposures to provide
credits to cardmembers. Typically, as an airline’s finan-
cial situation deteriorates the Company increases cash
held to protect itself in the event of an ultimate liqui-
dation of the airline. The Company’s goal in these dis-
tressed situations is to hold sufficient cash over time to
ensure that upon liquidation the cash held is equivalent
to the credit exposure related to any unused tickets.
Note 15 STOCK PLANS
Stock Option and Award Programs
Under the 1998 Incentive Compensation Plan and previ-
ously under the 1989 Long-Term Incentive Plan (the
Plans), awards may be granted to officers and other key
individuals who perform services for the Company and
its participating subsidiaries. These awards may be in the
form of stock options, restricted stock, performance
grants and similar awards designed to meet the require-
ments of non-U.S. jurisdictions. The Company also
has options that remain outstanding pursuant to a Direc-
tors’ Stock Option Plan that expired in 2003. Under these
plans, there were a total of 68 million, 78 million and 85
million common shares available for grant at
December 31, 2004, 2003 and 2002, respectively. Each
option has an exercise price equal to the market price of
the Company’s common stock on the date of grant and
with a term of no more than 10 years. Options granted in
2004 and 2003 generally vest ratably at 25 percent per
year beginning with the first anniversary of the grant date.
Options granted prior to 1999 and in 2002 generally vest
ratably at 33
1
⁄
3
percent per year beginning with the first
anniversary of the grant date. Options granted in 1999,
2000 and 2001 generally vest ratably at 33
1
⁄
3
percent
AXP
AR.04
110
Notes to Consolidated Financial Statements